Visualization: HICHERT®SUCCESS-charts with SAP BusinessObjects
How can HICHERT®SUCCESS be implemented in SAP BusinessObjects Design Studio and SAP BusinessObjects Dashboards (Xcelsius)? Well, in Xcelsius this is made possible very easy by graphomate for a long time now, and soon, by the mid of 2013, it will be able to do with graphomate in Design Studio, too.
HICHERT®SUCCESS is a concept with one goal in mind: making dashboards and reports meaningful.
Essentially, the aim is to present the information which shall be presented in an easy to understand way to the recipient: Informing rather than decoration! We abstain from all kind of effects, shading or meaningless use of colors. All diagrams are reduced to its essentials. In this Video by Roman Griesfelder, the basic ideas of HICHERT®SUCCESS are explained in an illustrative way.
One substantial goup of rules in HICHERT®SUCCESS is called UNIFY. What is the same shall be shown in the same manner. This is the reason why we show actual annual values in black, planned values hollow and forecast values hatched – company-wide in the same manner. No legends are needed as the recipient is able to deduct the meaning of the value at first glance.
This example made with SAP BusinessObjects Design Studio is an exemplary demonstration of the use of UNIFY:
This example is based on a BW-Query, which can be filtered, using drop-down-boxes. Fast and easily made by using the built-in scripting language of Design Studio. Even I who is not a coder can achieve results like this really fast.
My personal highlights of Design Studio: Easy integration of BW-Queries, the so called “Initial-Views” – which is a “lean” Query Designer – and the scripting language which is based on javascript.
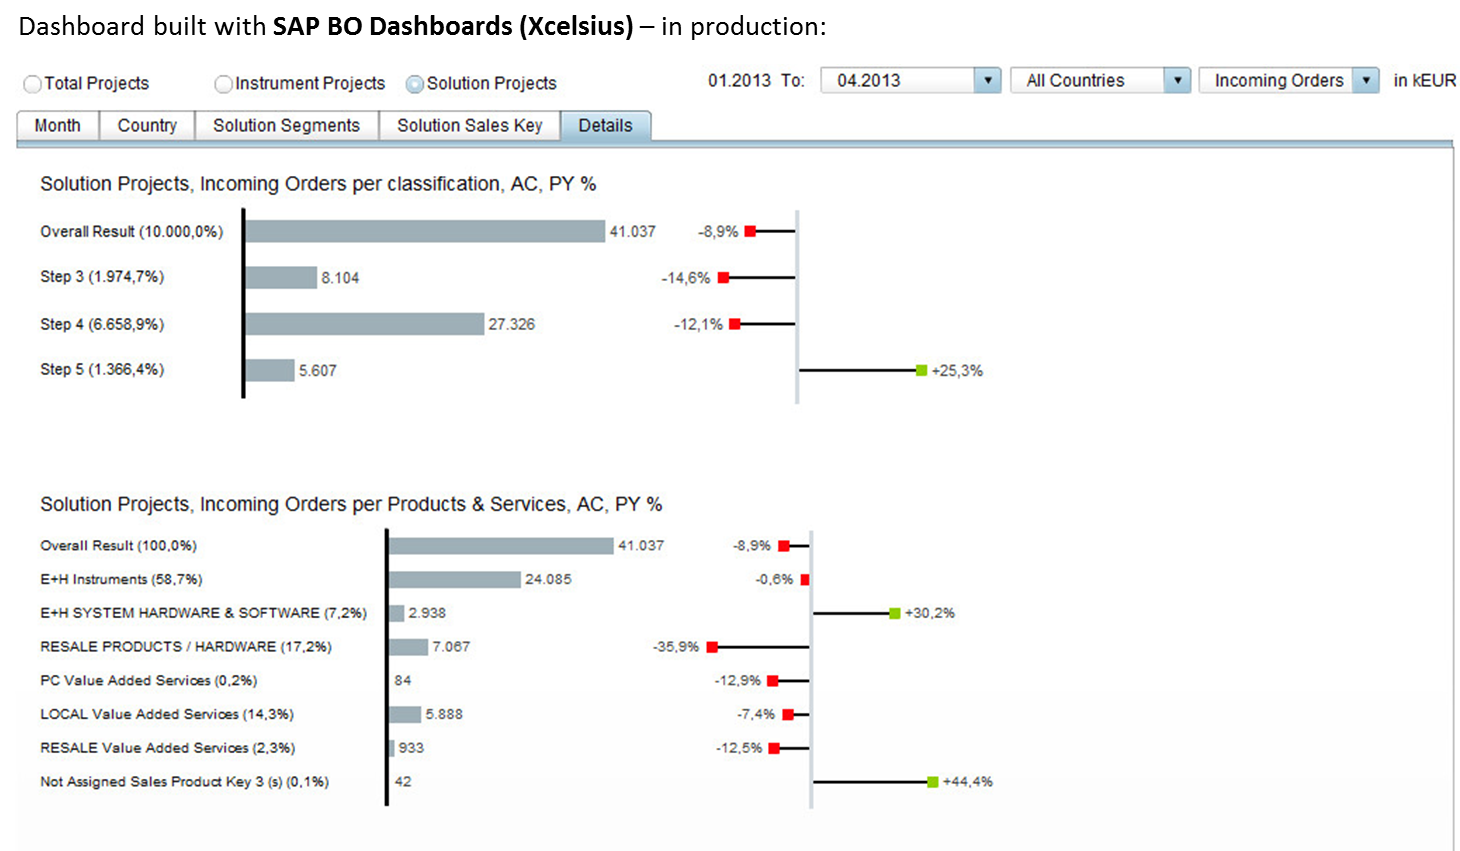
One concrete example: Our customer ENDRESS+HAUSER(E+H) are working with the rules of HICHERT®SUCCESS for several years now – in all their dashboards.
This dashboard for project management on the basis of SAP BusinessObjects Dashboards (Xcelsius) is in productive use at E+H since last year.
Well, even E+H have been waiting patiently for the release of Design Studio. The waiting was worthwile as you can easily rebuild the Xcelsius dashboards with our graphomate plug-in for Design Studio:
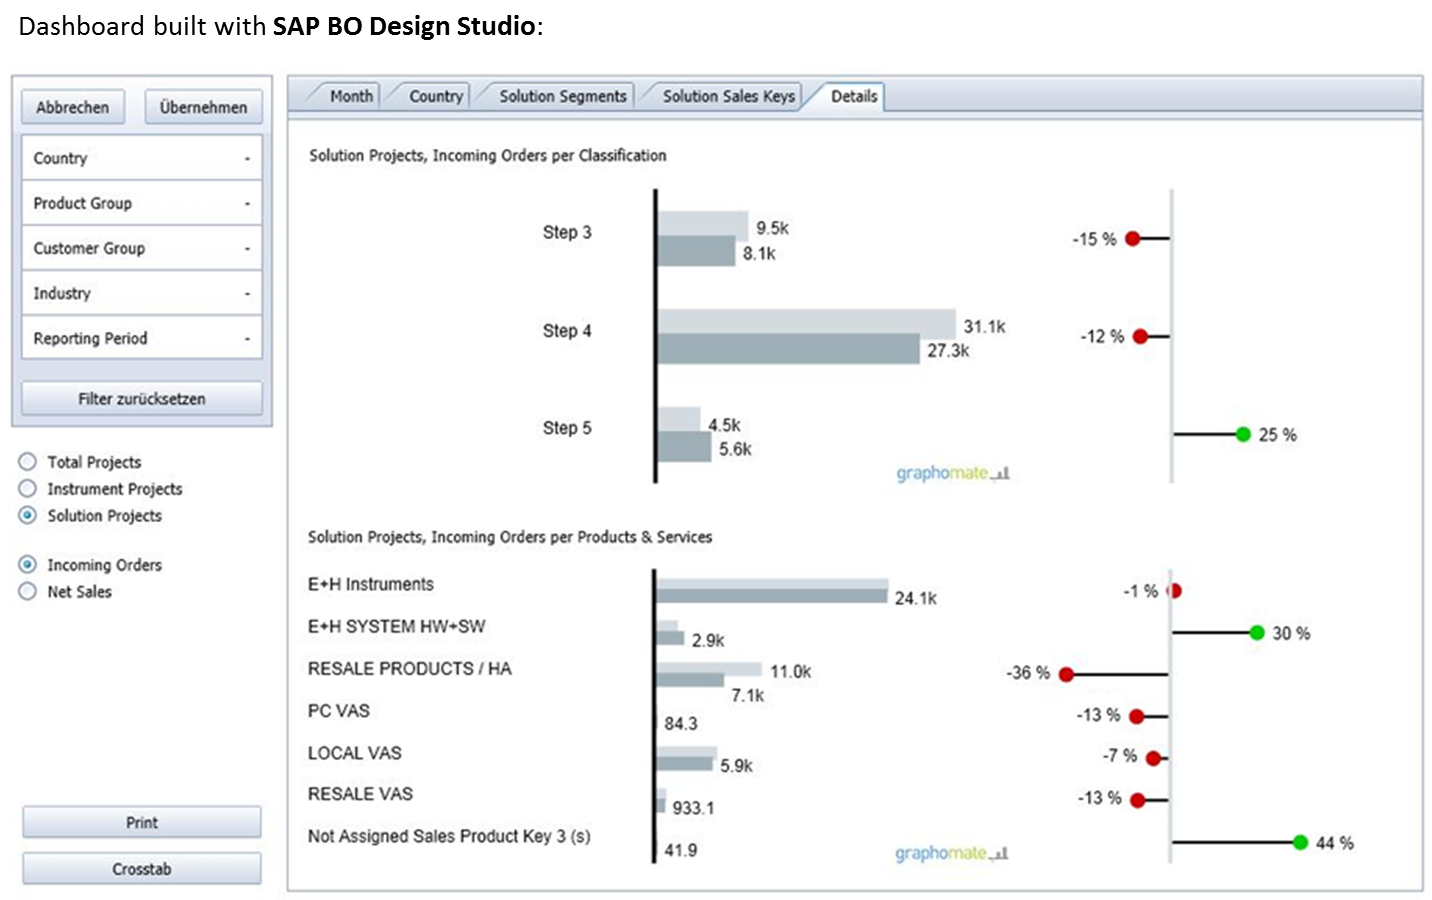
True, these are only Test-versions of our dashboards in Design Studio. But it became clear that the SDK for Design Studio will be very powerful. We could easily integrate our HTML5-developments.
It is planned that everyone can access the SDK in a BETA version by the middle of the year. You can get a first impression of how graphomate is integrated in Design Studio and how it can be used in this – well, kind of – english Video.
At the moment we are working on a less complex user interface – similar to that of Xcelsius – and are working on bug-fixing.
Good news: the license for the graphomate addon not only contains the addon for SAP BusinessObjects Dashboards (Xcelsius) but also the plugin for Design Studio. SAP shows us the way ;-).
One question remains: Why are there two SAP tools the development of dashboards? This will be the topic of another blog entry. Just to give you a hint: I think both are important.
Hoping for warmer moments,
![]()
_
![]()
This file is licenced under the Creative Commons-Licence.