Visualization: depressive diagrams
This infographic taken from the German newspaper “Die Welt kompakt” did cause me some mental stress. It tries to explain who actually earns money with depressions – the pharmaceutical industry. Take a look at my quickly developed remedy.
In order to make it easier for non-German readers I decided to change some of the headings. You can see a copy of the original in the German part of this article above:
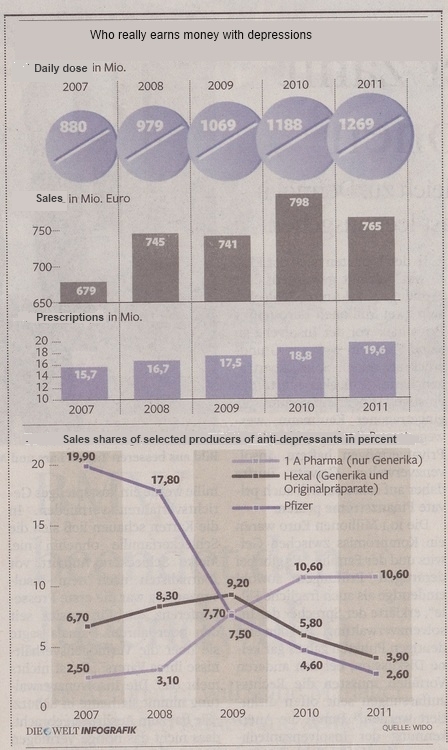
[Source: “Die Welt kompakt”, p. 22, March 20, 2013]
Bubbles, cut axes and a spaghetti diagram at the bottom: this infographic from the “Welt kompakt” is not really easy to understand. I know I am a nitpicker, but this graphic will be seen by millions of people and I ask myself: Why do they have to deal with a second digit after the decimal place in the spaghetti diagram?
And as always: Let me give you counter-proposal based on our graphomate addon for SAP BusinessObjects Dashboards:
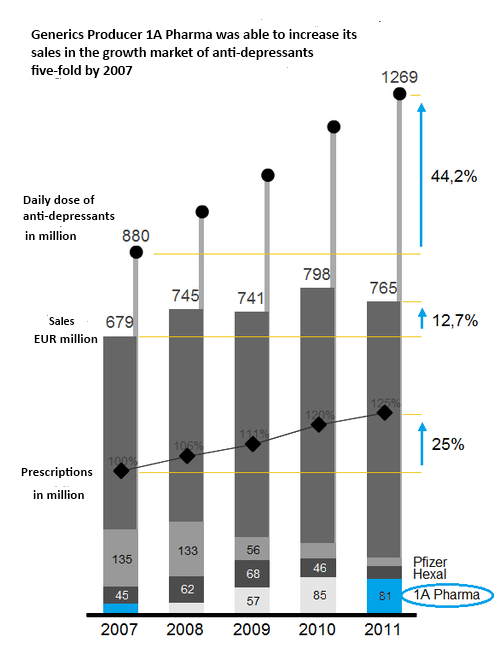
I needed some time until I realized the best way to show the development of prescriptions:as an index.To use bubbles in order to show development over time is particular unsuitable choice.
As always, I developed this diagramm according to the SUCCESS-Rules by Rolf Hichert – in this case I focused on the “Simplify-Rule.” All data is shown in one diagram and the recipient can see all relevant fact at a glance.
I made this diagram with our graphomate addon in SAP BusinessObjects Dashboards (Xelsius) – and in the near future I will make them with Design Stuio, too.
Considering this, I made another choice: I will continue reading the “Süddeutsche Zeitung”.
The best,
![]() _
_
_
![]()
This file is licenced under the Creative Commons-Licence.