Tableau Desktop
Available graphomate products for Tableau Desktop
Please note: For Tableau Desktop, the graphomate suite is available for free.
Tableau is a powerful visual analytics platform that helps organisations visualize and analyse data. With Tableau, users can easily transform data into meaningful and interactive dashboards and reports to make a successful decision.
Founded in 2003 as a spin-off from Stanford University (USA), Tableau has filled the Gartner Magic Quadrant for Business Intelligence “Leaders” position over the last decade in a row.
With its drag and drop functionality users are able to create complex visualizations without writing one line of code. Dashboards and reports are literally set up within a few clicks – either in the Tableau desktop application or online in Tableau Cloud.
Tableau has moved from a pure visualization tool – Tableau Desktop/Cloud – to a comprehensive BI platform: Tableau Server and Tableau Prep help to set up, organise and manage a data warehouse.
Let your visualization ideas come true with Tableau
To get started, you can use a range of standard chart types – such as bar, column, line and pie charts as well as Gantt charts, treemaps, box plots, etc. – out of the box. These templates can be extensively edited and extended.
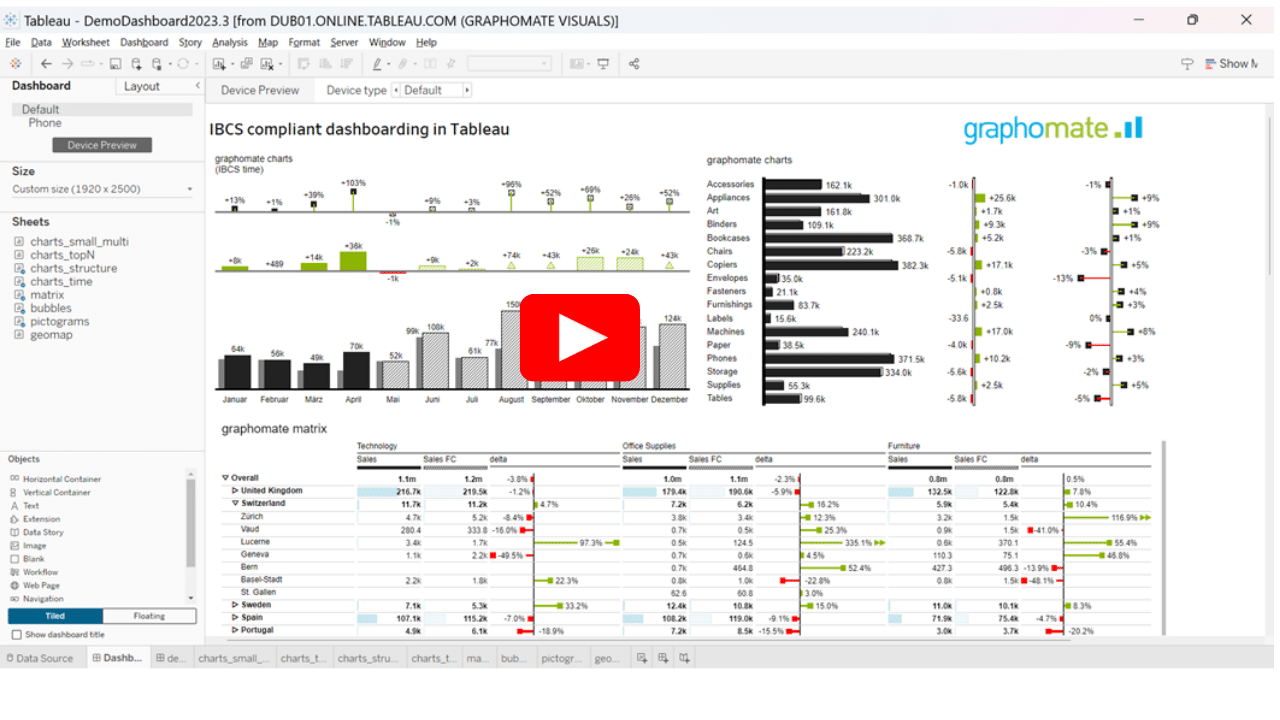
Nevertheless, our graphomate extensions, which integrate seamlessly, create added value in Tableau – especially in the financial sector and when creating visual tables. For example, profit and loss calculations can be easily mapped as waterfalls with our graphomate charts and the graphomate matrix enables a hierarchical visualization of dimensions.
graphomate charts and graphomate matrix for Tableau


