graphomate
pictograms
Pictorial diagrams
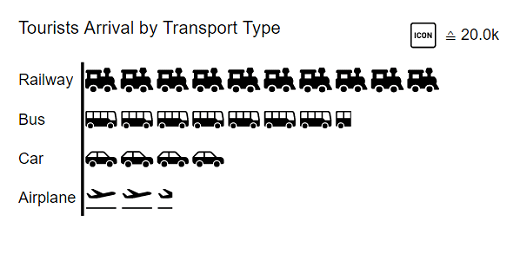
Pictograms are used for simplified graphical representation with the help of symbols and icons. Thus, “complex” facts are illustrated quickly and comprehensibly. A well-known example are pictograms that represent emotions, also known as smileys.
Our graphomate pictograms for Microsoft Power BI are available exclusively at Microsoft AppSource:
Advantages of graphomate pictograms at a glance
- freely selectable icons per data series and data point
- horizontal or vertical alignment
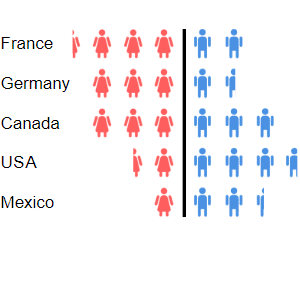
- alternative: central axis, from which a data series begins to the left and right
- any image (jpeg, gif, png, svg) can be used via DataURL
The graphomate pictograms are available for
“Talking” pictures for your business
We had the idea to use these features in business intelligence as well as controlling. The question was: Can we present symbols in diagrams as a further standardization option for certain products or business areas?
This resulted in our graphomate pictograms: a component for Power BI, Tableau and SAP Analytics. graphomate pictograms easily depict economic figures with the help of different icons within one diagram.
Viewers are able to grasp the meaning of the figures displayed without a key. The scaling of an icon can be set to a fixed unit, which ensures comparability. Our pictograms can be aligned horizontally and vertically as well as with a central axis.
Science has established …
According to a scientific study, it is easier for viewers to recall certain figures and their correlation with one another from memory if a graphic representation contains pictograms or icons. Viewers are also more likely to actively reflect upon a graphic representation if it contains pictograms.
Pictograms are a welcome change and encourage further exploration of the depicted data or issues.
Otto Neurath und ISOTYPE
When addressing the topic of pictograms, the path almost always crosses the concept of Isotype. From the 1920s onwards in Austria, Otto Neurath and his team investigated how to make social and economic facts accessible to the working population with simple pictograms.
The so-called Isotype was developed from the Viennese method of image statistics. The acronym Isotype means International System of Typographic Picture Education. Innovatively, facts were conveyed in a more understandable, neutral and uniform manner. The system includes a defined set of pictograms as well as grammar rules that determine the way the pictograms are combined.
Conclusion: We see graphomate pictograms as an extension of our product range for the standardization of information presentation. With the help of graphomate pictograms, additional content information is more uniform and thus more easy to grasp in visualizations. Try it out and install our demo versions for SAP Analytics, Power BI or Tableau.

