Microsoft 365
These graphomate products are available for Microsoft 365
In business, the use of Microsoft products is omnipresent: Excel and PowerPoint are indispensable. The switch to Microsoft 365 opens up even more collaboration options – both on the web and on the desktop. However, the new technology underlying Microsoft 365 also opened up new possibilities for us: In the future, we will be able to offer the complete graphomate suite for Microsoft 365.
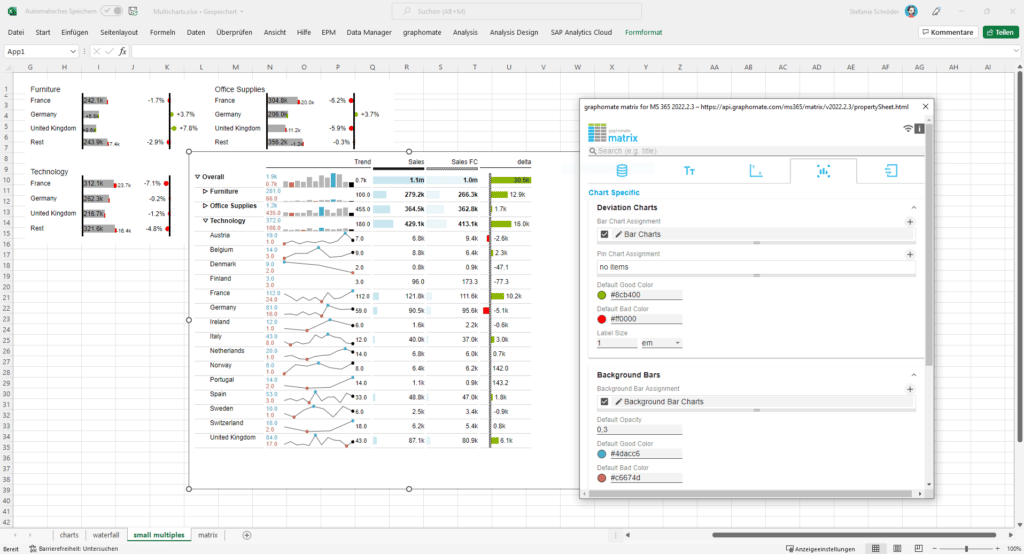
Use our graphomate charts and graphomate matrix in Excel and embed your diagrams in PowerPoint slides. Configure the visuals as you know it from BI frontend tools.
Uniform reporting according to IBCS
With our certified Microsoft 365 extensions, you can easily apply the International Business Communication Standards (IBCS) in Excel and PowerPoint. Reduce repetitive steps in report creation and use the functionality of embedding our visualisation extensions in PowerPoint instead. If the data situation changes, for example at the beginning of a new month, update the graphics and your presentation and reports with a single click.

graphomate in Excel und PowerPoint
Create your IBCS charts and tables based on Excel data directly in Microsoft Excel. Use the same user interface as you know from the other BI environments we support. The range of functions is also identical, so you can create chart templates in Excel and use them in SAC, Power BI and Tableau
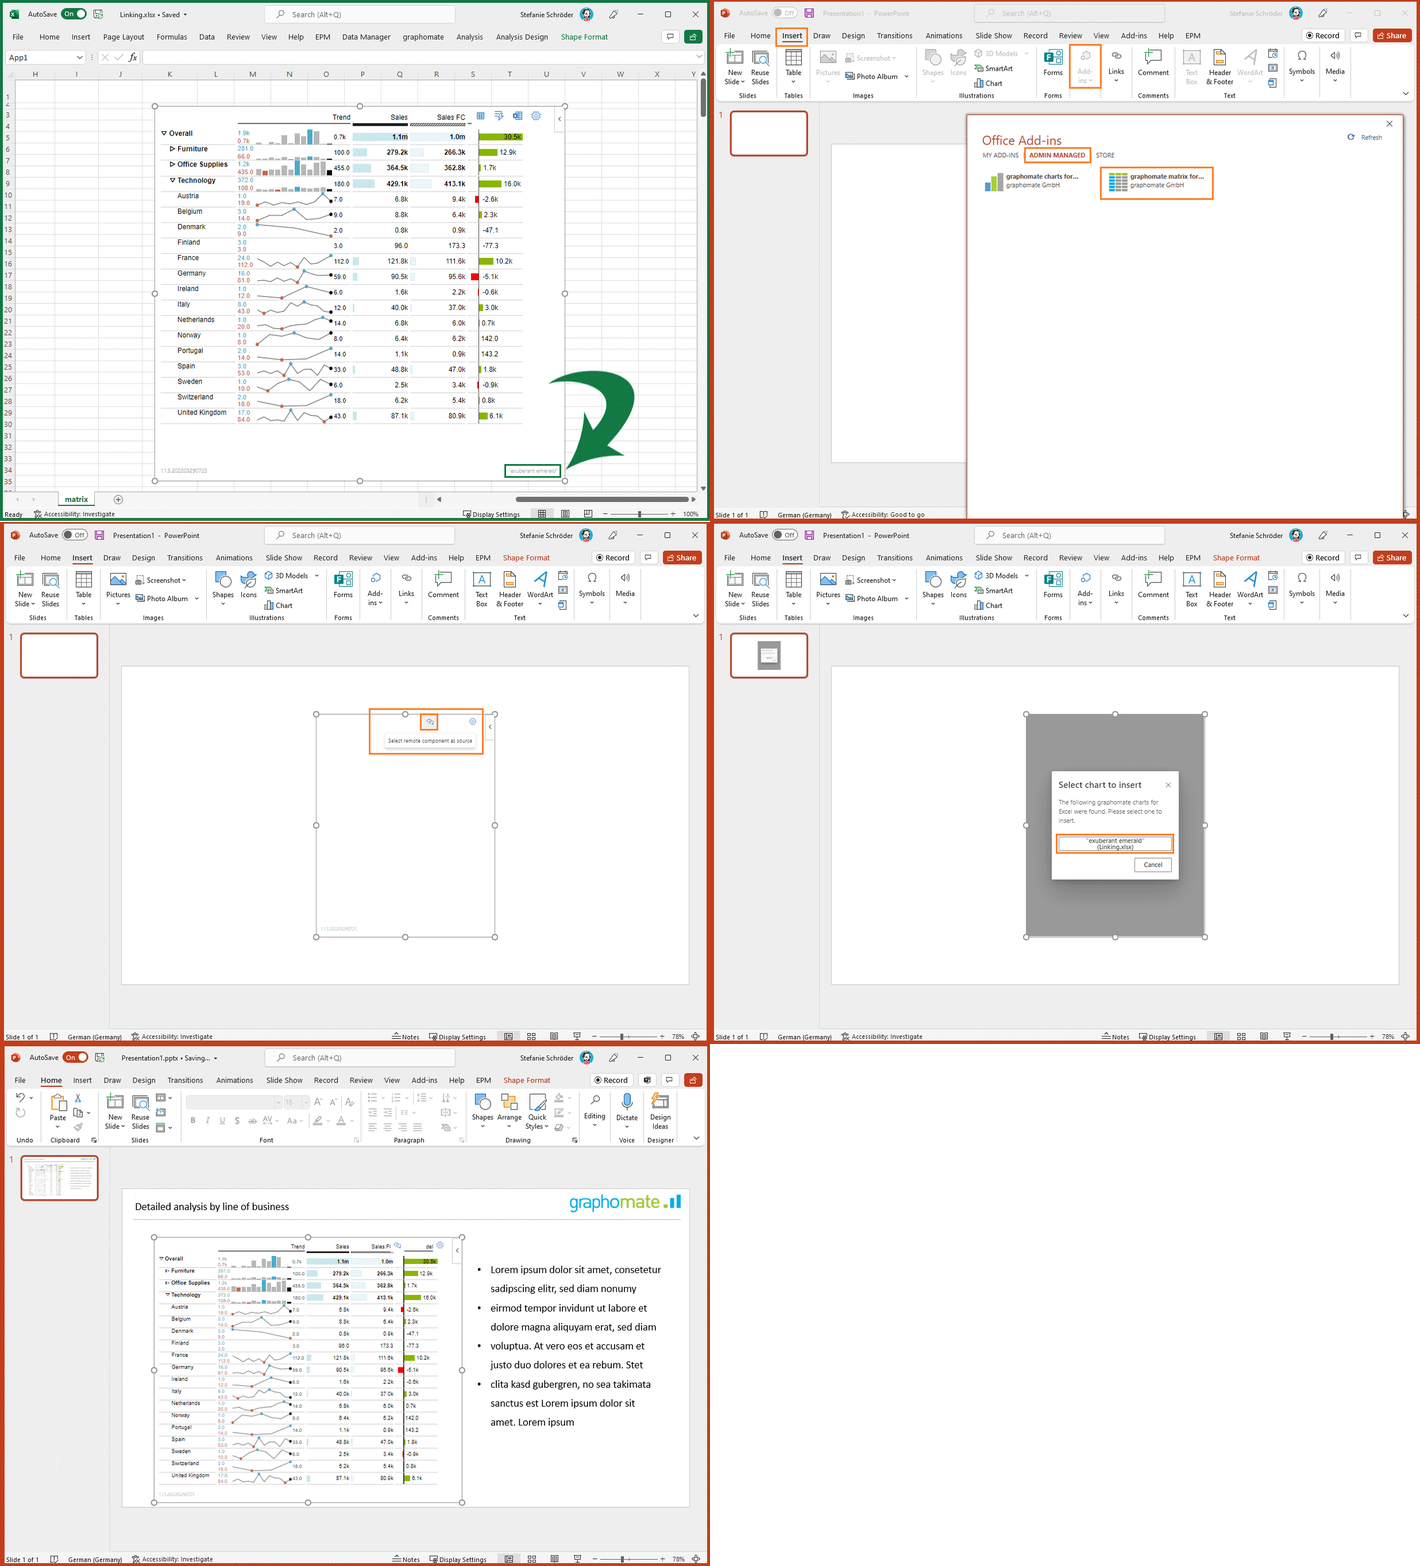
You can easily integrate the created visualizations into PowerPoint and update them with new values as needed. The interactive features such as expanding and collapsing hierarchy levels of the graphomate matrix can be used in PowerPoint without restrictions.

Visualization of your OLAP data in Excel with graphomate
Use Excel as a front end for your data analysis – e.g. via the SAC Add-In for Microsoft 365, SAP Analytics Cloud for Excel, TM1 or others. You can also easily integrate this data with our graphomate charts and the graphomate matrix to quickly produce IBCS-compliant visualizations – in graphomate matrix even with sparklines and sparkbars.
