graphomate
matrix
High-performance tables
The graphomate matrix is our new table component. Tables are omnipresent, no report can do without them. Microsoft Excel is still a favorite tool for data collectors. However, often after the first trial runs with table components in BI front end tools, disappointment sets in: While the access to data is now possible without much crunching of numbers, the offered formatting options are very limited.
Our graphomate matrix for Microsoft Power BI are available exclusively at Microsoft AppSource:
Advantages of the graphomate matrix at a glance
- data-driven formatting
- own formatting language
- depiction of hierarchies in rows AND columns
- smooth scrolling
- no data restrictions due to state-of-the art technology
- IBCS-compliant
Live Report

Try graphomate matrix directly in the Power BI report. For example, by clicking on an element in graphomate matrix, you can set a filter state on the whole report. The visuals adapt according to the selection.
The graphomate matrix is available for


Note: The graphomate tables for SAP Web Intelligence are still available.
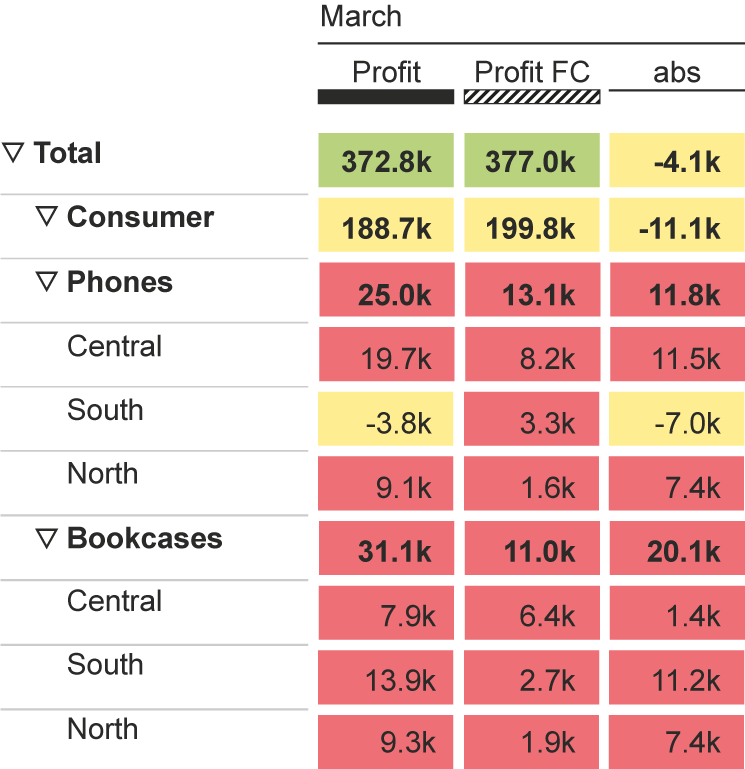
Our matrix has a lot to offer!
This is where we start: comprehensive – even conditional – formatting options for each cell, row or column, always ensuring a high performance level! With our own formatting language – the Cell Formatting Language (CFL), which is based on JavaScript – you are entirely free to customize the appearance of the matrix.
You want to highlight individual cells depending on their value? Highlight totals or rows? Use a table as a heatmap? Set the font size of each cell depending on the value? Use complex number formats?
graphomate matrix realizes all these requirements for table design!
graphomate makes your individual table come true
If you have special requirements, feel free to tell us and we will provide a script which fulfills your exact needs. If you want to do the coding yourself, we assist you in programming the CFL with a simple web editor. It is capable of auto-completion and syntax highlighting. Code examples like micro-pies or heat-map assist you in getting familiar with the CFL.
The graphomate matrix replaces graphomate tables, a product we have offered since 2014. Although graphomate tables offered the possibility to map IBCS requirements to a table with a few clicks, our customers requested these same features and even more formatting options for very large tables.
As our first goal is to satisfy our customers we worked hard to develop the graphomate matrix. High performance meets the highest flexibility possible. Fixed row and column headers and smooth scrolling are only two remarkable features.
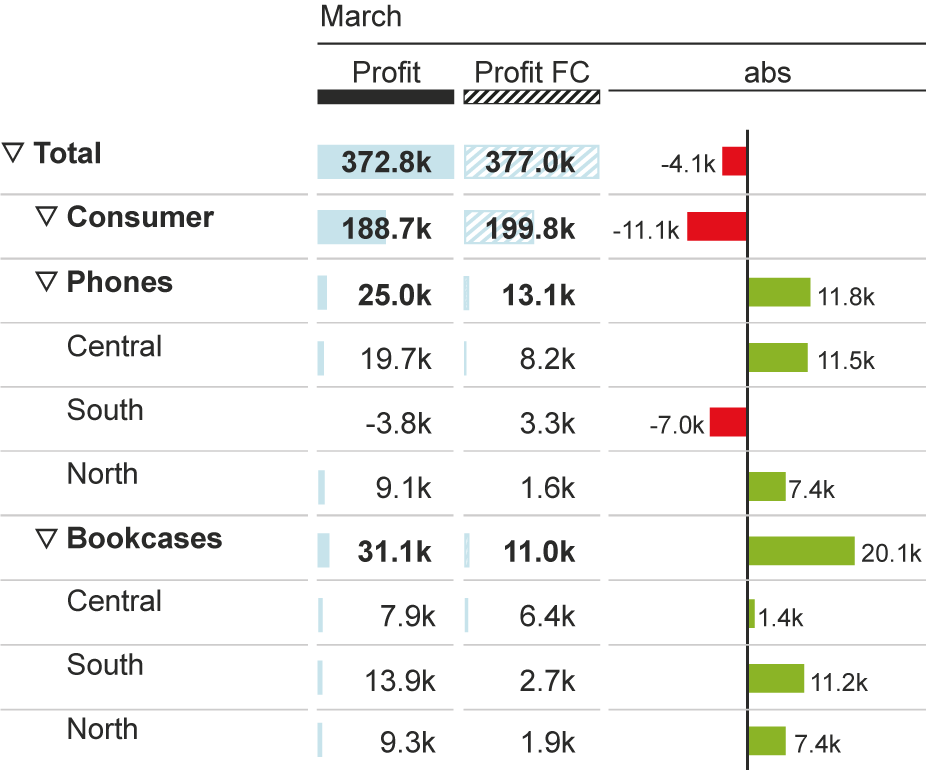
The graphomate matrix also offers popular features for meeting IBCS requirements already familiar from graphomate tables including
- deviations as bar or needle diagram
- column scenarios and
- In-Cell Charts
that can easily and flexibly be implemented.
Furthermore, the graphomate matrix allows both a hierarchical and a tabular (Cross Tab) view. Especially the latter was requested by many customers. In addition, hierarchies can also be used in columns and further columns can be supplemented with your own calculations such as possible deviations.

