Visualisierung: Bilder gegen den Herzinfarkt
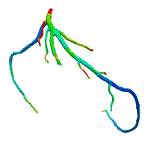
Michelle Borkin aus Harvard zeigte die Ergebnisse ihrer Forschungen zur Visualisierung von Blutflüssen in Herzkranzgefäßen und belegte damit nachdrücklich, dass 3D und quietschige Farben nichts bringen … großartig! English version below …
Visualisierungen können Leben retten. Der Arzt Dr. John Snow zeichnete beispielsweise Mitte des 19.Jahrhunderts eine Karte von Cholerafällen in London und konnte so den verseuchten Brunnen ermitteln und versiegeln. Die Choleraepidemie kam zum Erliegen.
Heute ist der Herzinfarkt eine der häufigsten Todesursachen in westlichen Gesellschaften. Die rechtzeitige Diagnose von Herzinfarktrisiken kann lebensrettend sein. Daher wird viel Energie und Geld in die frühzeitige Erkennung von Verdachtsmomenten für den Herzinfarkt aufgebracht.
Hauptursache eines Herzinfarkts sind Gefäßwandveränderungen der Herzkranzgefäße. Fetteinlagerungen – sog. Plaques – in den Gefäßwänden können sich vergrößern und die Gefäßwand zum Reißen bringen. In der Folge bilden sich Gerinsel und es besteht die Gefahr eines Gefäßverschlusses, der zum Herzinfarkt führen kann.
Es gibt eine Möglichkeit diese gefährlichen Plaques ohne Eingriff in den Körper zu erkennen, denn die Gefäßwandbereiche mit vergrößerten Plaques zeichnet eine Eigenschaft aus: die Fließgeschwindigkeit des Blutes (ESS – endothelial shear stress) ist hier aufgrund der Einbuchtung geringer.
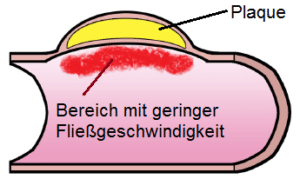
Abb. 1: Herzkranzgefäß mit Plaque (Quelle:eigene Darstellung)
Um die Fließgeschwindigkeit zu messen legt man die Patienten in einen Computertomograph. Die so gewonnen Daten werden im Computer verarbeitet und anschließend visualisiert. Spezialisten können auf Basis dieser Visualisierungen das Risiko eines Herzinfarktes diagnostizieren.
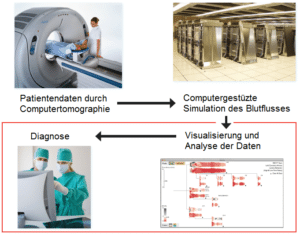
Abb. 2: Der non-invasive Diagnoseprozess (Quelle:eigene Darstellung)
Soweit zum medizinischen Hintergrund!
Michelle Borkin und Ihre Forschungsgruppe untersuchen nun in Ihrem Artikel verschiedene Möglichkeiten, die gewonnen Simulationsdaten zu visualisieren. Das Team war überzeugt, dass die 2D-Projektion der Daten in grau/rot, die man mit einer neuen Visualisierungssoftware (HemoVis) entwickelt hatte, der herkömmlichen 3D-Regenbogenfarben-Darstellung überlegen war.
Ziel der dem Artikel zugrundeliegenden Studie war herauszufinden, welche Darstellungsart am besten geeignet ist, schnell und effizient Zonen mit niedriger Flussgeschwindigkeit des Blutes (ESS) zu erkennen.
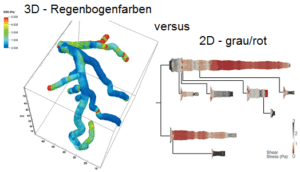
Abb. 3: 3D-Regenbogenfarben vs. 2D-grau/rot
Auf den Punkt gebracht: Ist es mit einer grau/roten 2D-Abbildung einfacher, potenzielle Herzinfarktregionen zu diagnostizieren als mit einer regenbogenfarbenen 3D-Abbildung?
Das Team um Michelle Borkin zeigte Kardiologen viele verschiedene Visualisierungen von Herzkranzgefäßen wie in Abb. 3 mit der Bitte die gefährdeten Zonen mit Plaques zu markieren. Anschließend werteten Sie die Ergebnisse sowohl qualitativ als auch quantitativ empirisch aus.
Das Fazit der Forscher ist eindeutig:
- 2D ist akkurater und effizienter als 3D – selbst bei räumlichen Abbildungen
In 3D-Visualisierungen wurden erheblich weniger gefährliche Plaqueregionen identifiziert und die Probanden brauchten mehr Zeit. Dieser Effekt stieg mit der Komplexität – der Verästelung der Herzkranzgefäße – der Darstellung an, was bei der 2D-Darstellung nicht der Fall war.
Erstaunlicherweise kam es nur bei der 3D-Darstellung zu einer geringen Zahl von falsch positiven Bewertungen: der Identifikation von Plaqueregionen, wo tatsächlich keine waren. - die grau/rot-Farbgebung ist den Regenbogenfarben vorzuziehen
Die Regenbogendarstellung ist deutlich weniger akkurat und effizient. Dieser Effekt verstärkt sich noch wenn in 3D visualisiert wird: Hier brauchten die Teilnehmer doppelt so lange zur Identifikation von Plaqueregionen im Vergleich zur grau/rot-Farbgebung.
Und was bedeuten diese Ergebnisse für die Geschäftskommunikation?
Ich sehe mich bestätigt, wenn ich gegen 3D und bunte Grafiken wettere.
Die Ergebnisse zeigen, dass Informationsvisualisierung zurückhaltend und verdichtet sein sollte. Genau das, was wir mit unseren add-ons für SAP BusinessObjects Design Studio und Dashboards (Xcelsius) zur Visualisierung von Geschäftszahlen umsetzen:
Viele Informationen gleichzeitig zeigen, um Vergleiche möglich zu machen. Dabei aber auf jegliches Rauschen – Hilfslinien, Rahmen, Farbnutzung ohne Sinn – verzichten.
Für mich sieht ein gutes Dashboard daher wie folgt aus – entwickelt in Dashboards (Xcelsius) mit dem graphomate charts add-on auf Basis erfundener Daten:
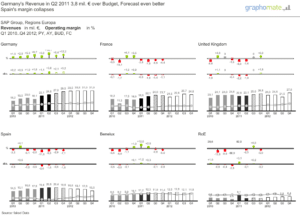
Abb. 4: Dashboard in grau/rot/grün mit hoher Informationsdichte und ohne Rauschen
- Wir nutzen Farben mit Bedacht: grün für „gute“ Abweichungen, rot für „schlechte“. „Red ist most eye-catching!“
- Wir zeigen viele Informationen gleichzeitig – inbesondere Abweichungen, um dem Adressaten Vergleichsmöglichkeiten zu geben. „Above all else, always show comparisons!“ wie Edward Tufte so treffend formuliert.
- Achsen und Diagrammelemente tragen Informationen zur Abbildung einer einheitlichen Notation. Legenden benötigen wir nicht mehr; der „Tennis-Blick“ – hin und her – entfällt.
Ein letzter Punkt: zur Frage der Ästhetik von Visualisierungen.
In meinen Präsentation wird mir oft entgegen gehalten, dass bunte Dashboards gefälliger und ästhetischer sind und daher von den Empfängern bevorzugt werden. Interessanterweise tauchte auch dieser Aspekt in der Studie auf: Zwei Teilnehmer waren zwar überzeugt, dass die grau-rote 2D- Visualisierung der regenbogenfarbenen 3D-Visualisierung überlegen ist. Dennoch bevorzugen Sie letztere aus ästhetischen Gründen.
Ganz ehrlich: Zur Befriedigung meiner ästhetischen Bedürfnisse gehe ich ins Museum oder blättere durch meine Gerhard Richter-Kataloge. Wenn ich informiert werden will, um bestmöglich Entscheidungen treffen zu können, setze ich auf klare einfache Darstellungen.
Ich hoffe, ich werde nie von diesen beiden Ärzten untersucht! 😡
Daher: viel bewegen, gesund ernähren und gegen Stress auch mal fünfe gerade sein lassen!
the best, Lars
______________
English version: Pictures against heart attack
Every year, the „masters“ of the visualization community come together at the Visweek. The conference is rather academically, so it is not so much in my focus. One presentation, however, has been attracting a lot of attention and was mentioned again and again in a lot of blogs and twitter.
Michelle Borkin from Harvard presented her results of her research in visualization of the blood flow in coronary arteries and emphatically proved that 3D and shrill colours do not achieve anything… great!
Visualizations may help to save lives. For example, in the mid-19th century, Dr John Snow, a medical doctor, draw a map of the number of cholera cases reported in London and was thus able to detect the contaminated well and to seal it. The epidemic outbreak could be stopped.
Today, myocardial infarction or heart attack is one of the most frequent causes of death in western societies. Early diagnosis of heart attack risk can save lives. Therefore, a lot of energy and money is spent to recognize harmful conditions which may lead to a heart attack early. The major causes for a myocardial infarction are vascular wall changes in the coronary arteries. Fat deposits – so called Plaques – in the vascular walls may grow and cause a rupture in the vessel’s wall. As a result, blot clots can form and the danger of an artery occlusion pose an immediate threat which may lead to a heart attack.
There is a possibility to recognize the dangerous plaques without surgical intervention as the vascular vessels with enlarged plaques have one common characteristic: the blood flow rate (ESS- endothelial shear stress) is lower because of the indentation.
Source: infovis2011_slides.pdf
To measure the blood flow the patient needs to be scanned by a computer tomograph. The data obtained are processed in a computer and then visualized. Specialists are able to diagnose the risk of a heart attack on the basis of these visualizations.
Source: infovis2011_slides.pdf
This is the medical background so far!
Michelle Borkin and her research group are now investigating in their article different means of visualizations for the collected data. The team was convinced that a 2D-projection in grey/red, which has been developed with the new visualization software (HemoVis), would be superior to the common 3D-rainbow colour presentation.
The aim of the study on which the article is based was to determine which presentation was best suited to recognize areas with low blood flow velocity (ESS) fast and efficiently.
To bring it to the point: Is it easier with a grey/red 2D-visualization to diagnose potential heart attack areas than with a rainbow-coloured 3D-figure??
Michelle Borkin’s team showed different visualizations of coronary arteries as shown in the picture above to cardiologists, requesting them to mark the endangered areas with plaque. Subsequently they conducted a qualitative as well as a quantitative analysis of the results.
The conclusion drawn by the researchers clearly indicates the following:
- 2D is more accurate and efficient than 3D – even in spatial illustrations
significantly less regions with dangerous plaques have been identified in 3D-visualizations and the participating doctors needed more time.
This effect increased according to the complexity – the branching of the coronary arteries – of the visualization, which was not the case in the 2D-visualization.
Most astonishingly, only the 3D-visualization produced a small number of false positive judgements: the identification of areas with plaque where in reality were none.
- The red/grey colours are preferable to the rainbow colours
The visualization in rainbow colours is less accurate and less efficient. The effect is further intensified if the visualization is made in 3D: The participants needed more than twice as long for the identification of regions with plaque compared to the red/grey colour scheme. What do these results mean for business communication?
I find myself confirmed when I speak vigorously against 3D and colourful charts.
The results show that visualization of information should be modest and condensed. This is exactly what we realize with our add-ons for SAP BusinessObjects Design Studio and Dashboards (Xcelsius) for the visualization of business figures.
Show as many information as possible at the same time to make comparisons possible. But do this without any noise – auxiliary lines, frames, use of colour without sense,
For me, a got dashboard has to look like the following – developed in Dashboards (Xcelsius) with the graphomate charts add-on on the basis of fictional data:
- We use colours with cautiously: green for „good“ deviations, red for „bad“. “Red is the most eye-catching colour!”
- We show a lot of different information at the same time – especially deviations, giving the recipients the possibility for comparisons. “Above all else, always show comparisons!” as Edward Tufte formulated pointedly.
- Axes and chart elements have information for the depiction of a consistent notation. We don’t need any legends; the “tennis view” – back and forth – is no longer necessary.
One last point: the question of aesthetics of visualizations.
In my presentations I am often confronted with the opinion that colourful dashboards are more pleasant and more aesthetic and therefore the recipients do prefer them. This aspect interestingly showed up during the study, too: two participants were convinced that the 2D- visualization is superior to the 3D- visualization. But because of aesthetical reasons they would prefer the last one.
Very honestly: for the satisfaction of my aesthetic needs I go to a museum or flip through my art catalogues. If I want to be informed in order to make the best possible decision I prefer clear and simple visualizations.
I hope that I will never have to be examined by these two doctors!
So: be active, keep to a healthy diet and to avoid stress try to take a relaxed view on things! 🙂
the best, Lars
__
 Die Beitrag bzw. Inhalt ist unter einer Creative Commons-Lizenz lizenziert.
This file is licenced under the Creative Commons-Licence.
