graphomate blog
meaningful visualization in focus
The purpose of visualization is insight, not pictures.
Ben Shneiderman
You are so beautiful …
This time a post that really deserves to be called ‘the goody I found’:
simply beautiful, almost art!
A new, native Power BI widget by Nicholas Lea-Trengrouse. He calls it Parastichy Visual and I find it exceptionally …
Today is our Christmas party
Always a special event, reflecting the traditions up here in the north:
Boßeln or in English roadbowling. Does it exist?
Especially BI consultants from the south of Germany have had a hard time getting used to …
mehr erfahrenLess is a bore …
It’s Friday morning and time again for “The goody I found (TGIF!)”… … this week it’s a Power BI Sales Dashboard on linkedin that caught my eye.
https://lmy.de/jeYxX
As you can see in the screenshot, the image …
mehr erfahrenIt’s the message, stupid!
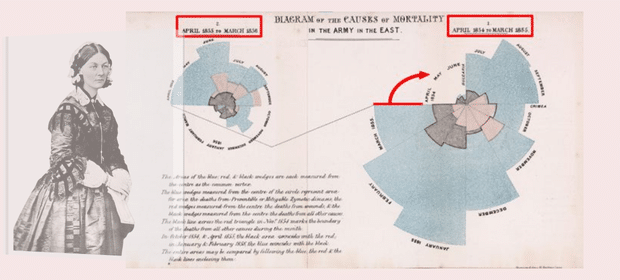
Todays Goody I Found is about the mother of modern nursing and a famous statistician: Florence Nightingale on of our DataViz heroes.
Florence Nightingale was sent to the Crimea in 1854, where the Crimean Wars were …
mehr erfahrenBeautiful, colorful bubbles
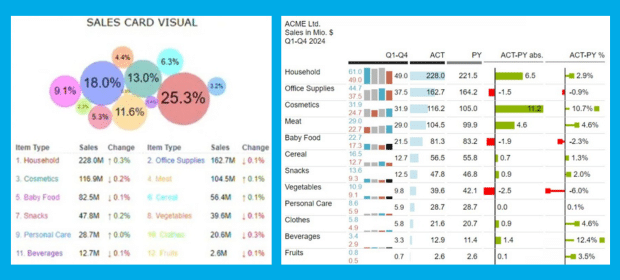
On the left you see a sales card visual for Power BI with a table for detailed data underneath.
It’s meant to be an “experience where users can effortlessly explore sales patterns and extract meaningful insights.”
I …
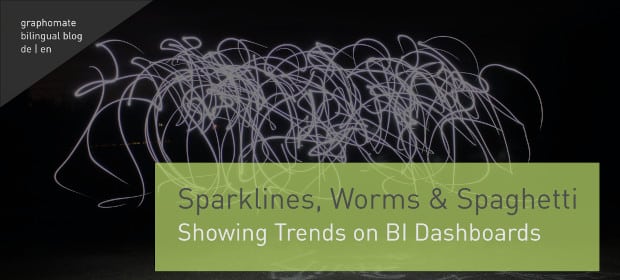
mehr erfahrenHow to show trends – Sparklines, Worms and Spaghetti
I’ve been a big fan of sparklines for over 15 years now, so I thought it was high time I provided a more in-depth review of these “word graphics”.
The “invention” of sparklines is attributed …
mehr erfahrenWe built a radar chart; but remain sceptical
At graphomate, we are known for graphomate suite and graphomate tiles – standard visualisation components that can be purchased and used “off-the-shelf”.
What is less well known is that we also put together custom visualisations …
mehr erfahrenShow the Data. Tell the Story.: Comments & Annotations for BI Dashboards
Data visualisations form the core of a BI dashboard. They take the myriad buckets of corporate data and turn it into something bite-sized, informative, and aesthetically efficient. However, there has arisen, especially in recent years, …
mehr erfahrenMy heroes of dataviz (5/5): Rolf Hichert – the man of standards
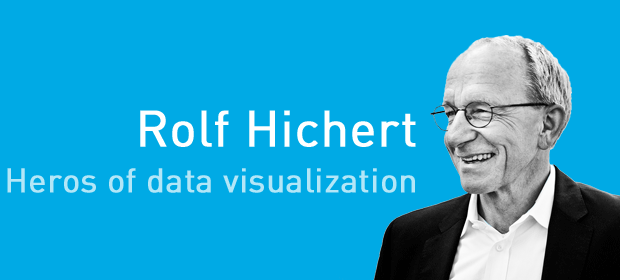
Finally, to the only data visualisation hero I know: Rolf Hichert. Without him, graphomate would not exist.
The story is just too good to be true: In 2009, I was supposed to realise a stacked …
mehr erfahren


