graphomate blog
meaningful visualization in focus
The purpose of visualization is insight, not pictures.
Ben Shneiderman
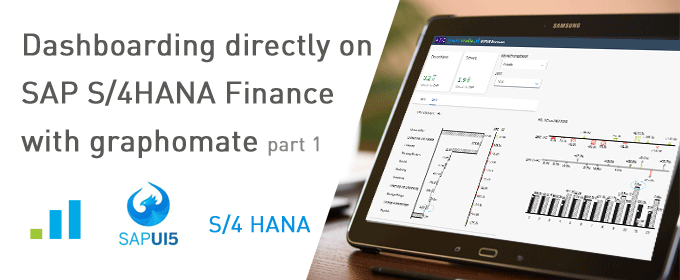
Dashboarding directly on SAP S/4HANA Finance with graphomate (I/II)
In many companies SAP S/4HANA is currently being dealt with – quite intensively. Although SAP has postponed the end of “normal” maintenance for SAP Business Suite 7 from 2025 to the end of 2027, there …
mehr erfahrenWhat’s new? – graphomate suite Release 2021.2
In this blog post, we would like to present to you our new and exciting features of the graphomate charts and the graphomate matrix. You can find the complete changelog for our release 2021.2 here. …
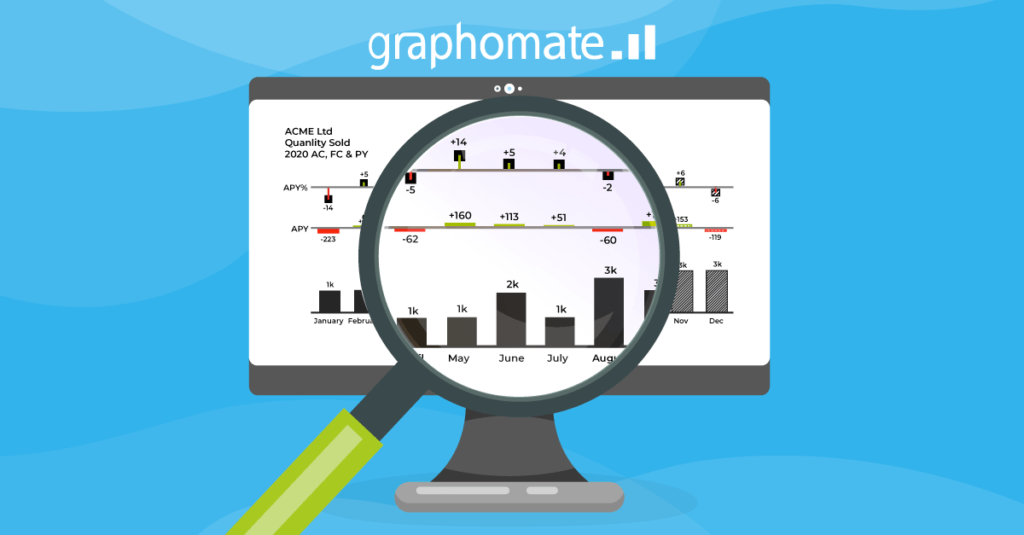
mehr erfahrenWhy a visual standardization in reports leads to a better understanding
You can find the english version of this article at out partners blog from Wiiisdom.
Kind regards,
Lars
This file is licenced under the Creative Commons-Licence.
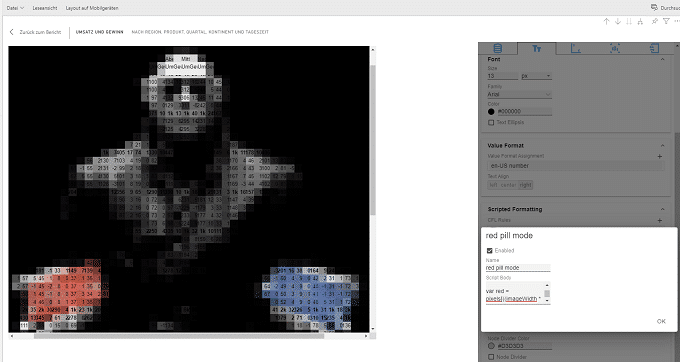
mehr erfahrenenter the matrix
The graphomate matrix is our new tabular visualization component for Microsoft Power BI, Tableau, SAP Analytics and SAP Lumira Designer. You heard right: we no longer only offer our products for SAP Analytics. Now you …
mehr erfahrenFinally: Solid, Outlined, Hatched … the book by Rolf Hichert and Jürgen Faisst
We have waited a long time, but now it’s available in English on demand: the book about visualization of management information by Rolf Hichert. No click instructions for generating a stacked bar chart in Excel, …
mehr erfahrenThe Imperfect World
In an ideal world, where data could be visualised in simplified and structured way, the Business Intelligence users would be happy people. Unfortunately, this is not always the case in SAP BusinessObjects Web Intelligence (WebI). …
mehr erfahrenBCG Matrix with graphomate bubbles
In a former blog post we already wrote about our graphomate bubbles in general. Today we would like to examine a specific use case: a dynamic BCG Matix usable as a filter element.
The …
graphomate charts and tables for UI5
The UI Development Toolkit for HTML5 (SAPUI5 or UI5) is SAP’s HTML5 framework that helps software developers to create user interfaces and to visualize data. UI5 is increasingly used in SAP tools: for example in Digital …
mehr erfahrenTips for Perfect Dashboards – An Interview
Dashboards offer great business value, as long as they are properly designed and used. Careful planning is as well a part of this process as experience in how the recipients use the dashboard.
In an …
mehr erfahren
