enter the matrix

The graphomate matrix is our new tabular visualization component for Microsoft Power BI, Tableau, SAP Analytics and SAP Lumira Designer. You heard right: we no longer only offer our products for SAP Analytics. Now you can also use our IBCS certified components in Power BI and Tableau.
The graphomate matrix is the successor of our popular graphomate tables. However, it is characterized by a fundamentally new architecture. This allows us to visualize even large amounts of data with high performance. Together with extensive formatting options and a new, data-driven interface, it adds exceptional value to all established reporting and dashboarding environments. It is a very powerful component whose application and user experience is identical in all the BI tools mentioned above. You can even exchange the formatting of a graphomate matrix between the BI tools – this is how consistent visualization for your reporting is supposed to be!
Overview
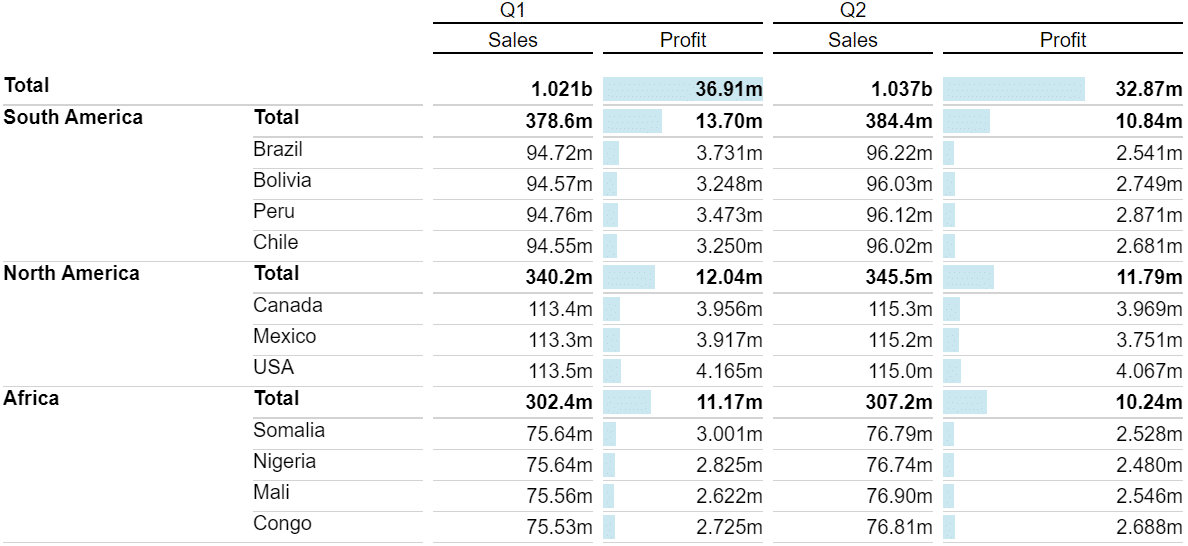
Popular features from our graphomate tables are of course also included in its successor. Everything that was possible so far, will also be possible with the graphomate matrix – only much more performant and flexible. A hierarchical display in the rows provides an overview of large amounts of data and allows the user to navigate effortlessly through the levels of hierarchical data – this also applies to external SAP BW hierarchies, which can now also be used in the columns. We have also extended the graphomate matrix with an alternative crosstable view that displays hierarchical data in multiple columns. A very common customer request…
A lot of work has also gone into improved in-cell diagrams. These are small diagrams that can be displayed within cells of the matrix and help the viewer to understand the proportions and relationships of the data more quickly.
IBCS-Ready
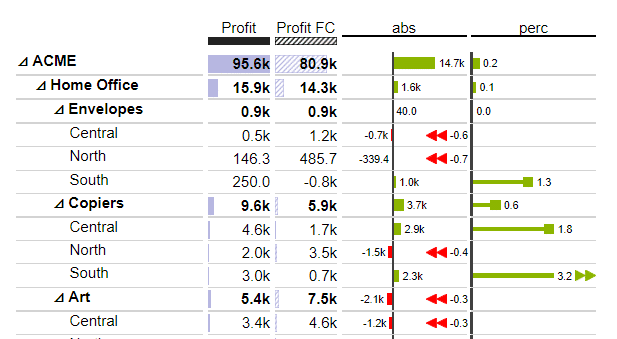
Of course, our new matrix has the appropriate settings to achieve meaningful representations using concepts of the International Business Communication Standards. Scenarios for specific key figures can be defined, and standardized patterns and colors make it easy to identify the type of key figure in question.
For better comparability of the data it is possible to adjust the scaling of in-cell elements. Thus, bars of the same values are displayed with the same length in the entire table, or even beyond it. In reality, however, a uniform scaling can quickly lead to significantly larger values overshadowing all other bars. Therefore it is also possible to adjust the scaling in the graphomate matrix so that a visual comparison between diagrams is possible despite outlier values. To meet even the most complex scaling requirements, rows, columns or other ranges of the matrix can use different scaling.
Flexible
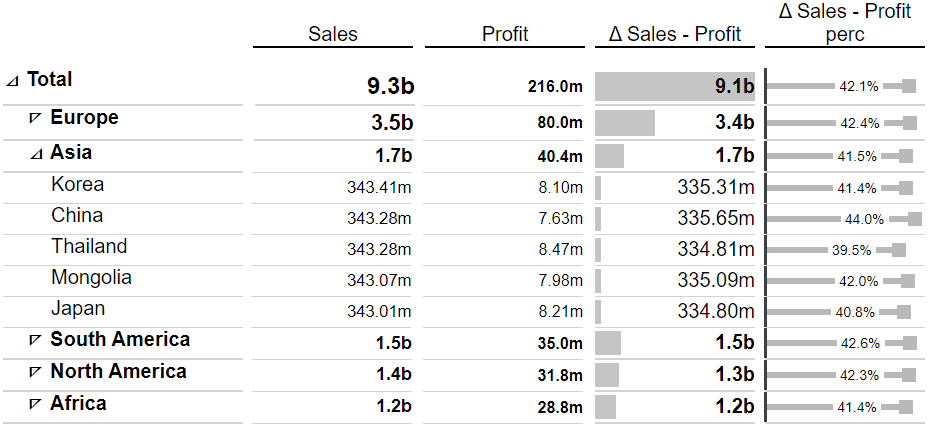
The most complex demands that were placed on our previous visualization components are naturally also incorporated into the development and further development of the graphomate matrix. Therefore, the number format configuration is more powerful than ever before. From the simple adjustment of separators to the automatic determination of thousand abbreviations for a data series, no wishes remain unfulfilled. In addition, any number of number formats can now be defined for different rows, columns, cells, or freely selectable ranges of the matrix. For example this makes it very easy to format %-columns differently than columns with absolute values.
In addition to the data-driven formatting options, there is another powerful way to implement conditional formatting in the graphomate matrix: The Cell Formatting Language (CFL). The CFL is a scripting language based on JavaScript and CSS, which allows extensive, data-driven formatting for each individual cell. It can be used, for example, to modify texts, redesign column headings, color cells based on the data, or add symbols and icons. The CFL can even be used to design new visualization features such as heat maps or scaled font sizes like on a tag cloud.
For example, the banner image at the top, which shows Morpheus with the red and blue pill, is a graphomate matrix – formatted with the CFL 🙂
Data Driven
The settings of the graphomate matrix are data driven. This means that you can define (conditional) formatting and other settings depending on dimensions and key figures. This new operating concept makes it possible, for example, in contrast to the graphomate tables, to format key figures differently or to calculate deviations no longer between column 2 and column 3, but between the years 2017 and 2018. This means that all settings remain valid even if the arrangement of the data changes due to interactions in the report. If the viewer filters out the first column, all deviations will still be calculated correctly, since the calculation does not refer to the displayed columns, but to the underlying years.
Performant
By using modern web technologies, we have succeeded in making it possible to display even very large amounts of data with the matrix. Most parts of the data are hidden under hierarchy nodes or scrollbars. Thus, the display systems only have to process the part of the data that can actually be seen. Therefore the bottleneck for loading times and for interaction with the data is no longer the rendering of the table, but rather depends on the BI tool and the corresponding backend systems.
For interested technology enthusiasts blog articles that explain individual technologies or background information on the graphomate matrix in more detail will follow in the future, so that our geeks are sometimes in the spotlight as well. Until then of course you can get an impression of our matrix by simply requesting a demo version.
Best regards,
Tim

This file is licenced under the Creative Commons-Licence.