
graphomate blog
meaningful visualization in focus
The purpose of visualization is insight, not pictures.
Ben Shneiderman
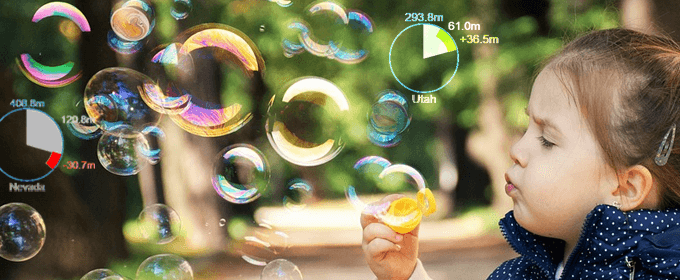
More than just shimmering bubbles
Once again, we sat down at the workbench to craft a new component. The result are the graphomate bubbles – a visualization component für SAP Design Studio, which can display either a scatter plot or …
mehr erfahren
SAP Design Studio: Raider is now called Twix, nothing else changes
SAP caused quite a stir with the announcement to fuse SAP Design Studio and SAP Lumira. This is my view on things – the usual disclaimer applies 😉 …
The most important thing in advance: …
mehr erfahren
graphomate twitters in Design Studio
While the popularity of social networks was increasing extremely over the last decade, companies decided to use them as a platform to advertise their products. There are many techniques for analyzing how the users consume …
mehr erfahren
Some news on our graphomate bullet graphs
Some time ago, we presented the graphomate bullet graphs extension for SAP Design Studio. Bullet graphs – originally designed by Stephen Few – are a more comprehensive alternative to gauges when it comes to visualizing data. In early March this year, Rolf Hichert and Jürgen Faisst suggested a few improvements, of which we naturally took the opportunity to incorporate into our extension…
mehr erfahren
Festive Creation of Legends
Christmas and its legends are right around the corner. A good time to give away our new legends: the graphomate legends.
Among others, Christmas legends revolve around immaculate conception, the road to Bethlehem, angels, …
mehr erfahren
Easter gift: graphomate charts for Lumira FREE
Easter is coming and while the kids raiding their nests, the parents often get nothing. We at graphomate want to react on this injustice and we also fill the nests of adults: At Easter we …
mehr erfahren
I prefer calculating
Pie charts are a popular target for many supposed visualization experts. And that is how it should be! However, this guest post by Manuel Sedlak sheds some new light on the pie chart.
In literature pie charts are …
mehr erfahren
graphomate Christmas treemaps for free
Christmas is coming and we do look forward to a peaceful time, family and the Christmas tree. Gifts play a certain role and we do not want to come second: during Christmas season, our graphomate …
mehr erfahren
From gauges to bullet graphs
Speedometer or gauges are still often used in dashboards to display Key Performance Indicators (KPI). But gauges use lots of space and are not very informative. The graphomate bullet graphs therefore offer an alternative for SAP …
mehr erfahren