Easter gift: graphomate charts for Lumira FREE

Easter is coming and while the kids raiding their nests, the parents often get nothing. We at graphomate want to react on this injustice and we also fill the nests of adults: At Easter we give away our graphomate charts for Lumira FREE.
SAP Lumira is a self-service, data visualization application for business users. With its interactive visualizations you are able to analyze data quickly and discover unique insights. With drag and drop elements and dynamic filters not only static documents can be created.
In this new environment we successfully integrated our graphomate charts and they feel right at home here:
Highlights:
3 new chart types
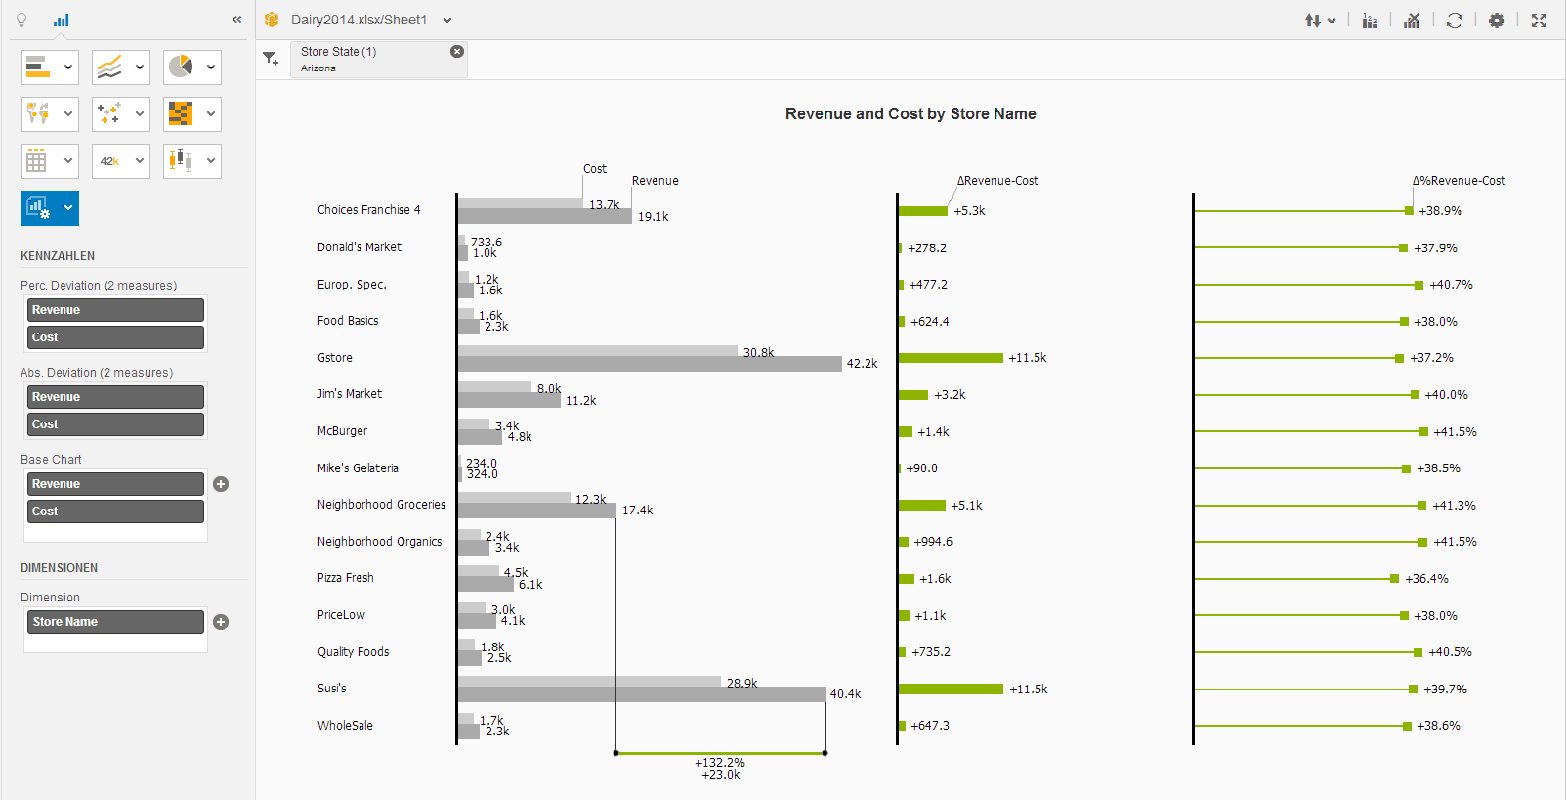
Choose between bars, columns and integrated deviations as they are already known from the graphomate charts for SAP BusinessObjects Design Studio. Bars are ideal for visualizing structural data, while column charts allow an insightful presentation of temporal sequences. In addition, the integrated deviations help to represent absolute differences extremely compact.
Deviations
Moreover there is the possibility to extend the base charts by absolute and percentage deviation charts or show the deviations separately.
Highlighting
By clicking on two different bars or columns a detailed comparison can be displayed temporarily. The absolute deviation between the selected values is highlighted.
– –
The download period of our FREE Lumira charts extension has expired. If you are still interested, please send an email to sales@graphomate.com.
You can use the graphomate charts for Lumira FREE without restrictions; however we ask for your understanding that we can not offer any support for the free version.
Happy Easter,
Tim & Daniel
PS: Unfortunately the trellis function can not be used due to Lumira SDK restrictions.

