The graphomate chartrix—our new one

We just released our all new graphomate chartrix for Microsoft Power BI.
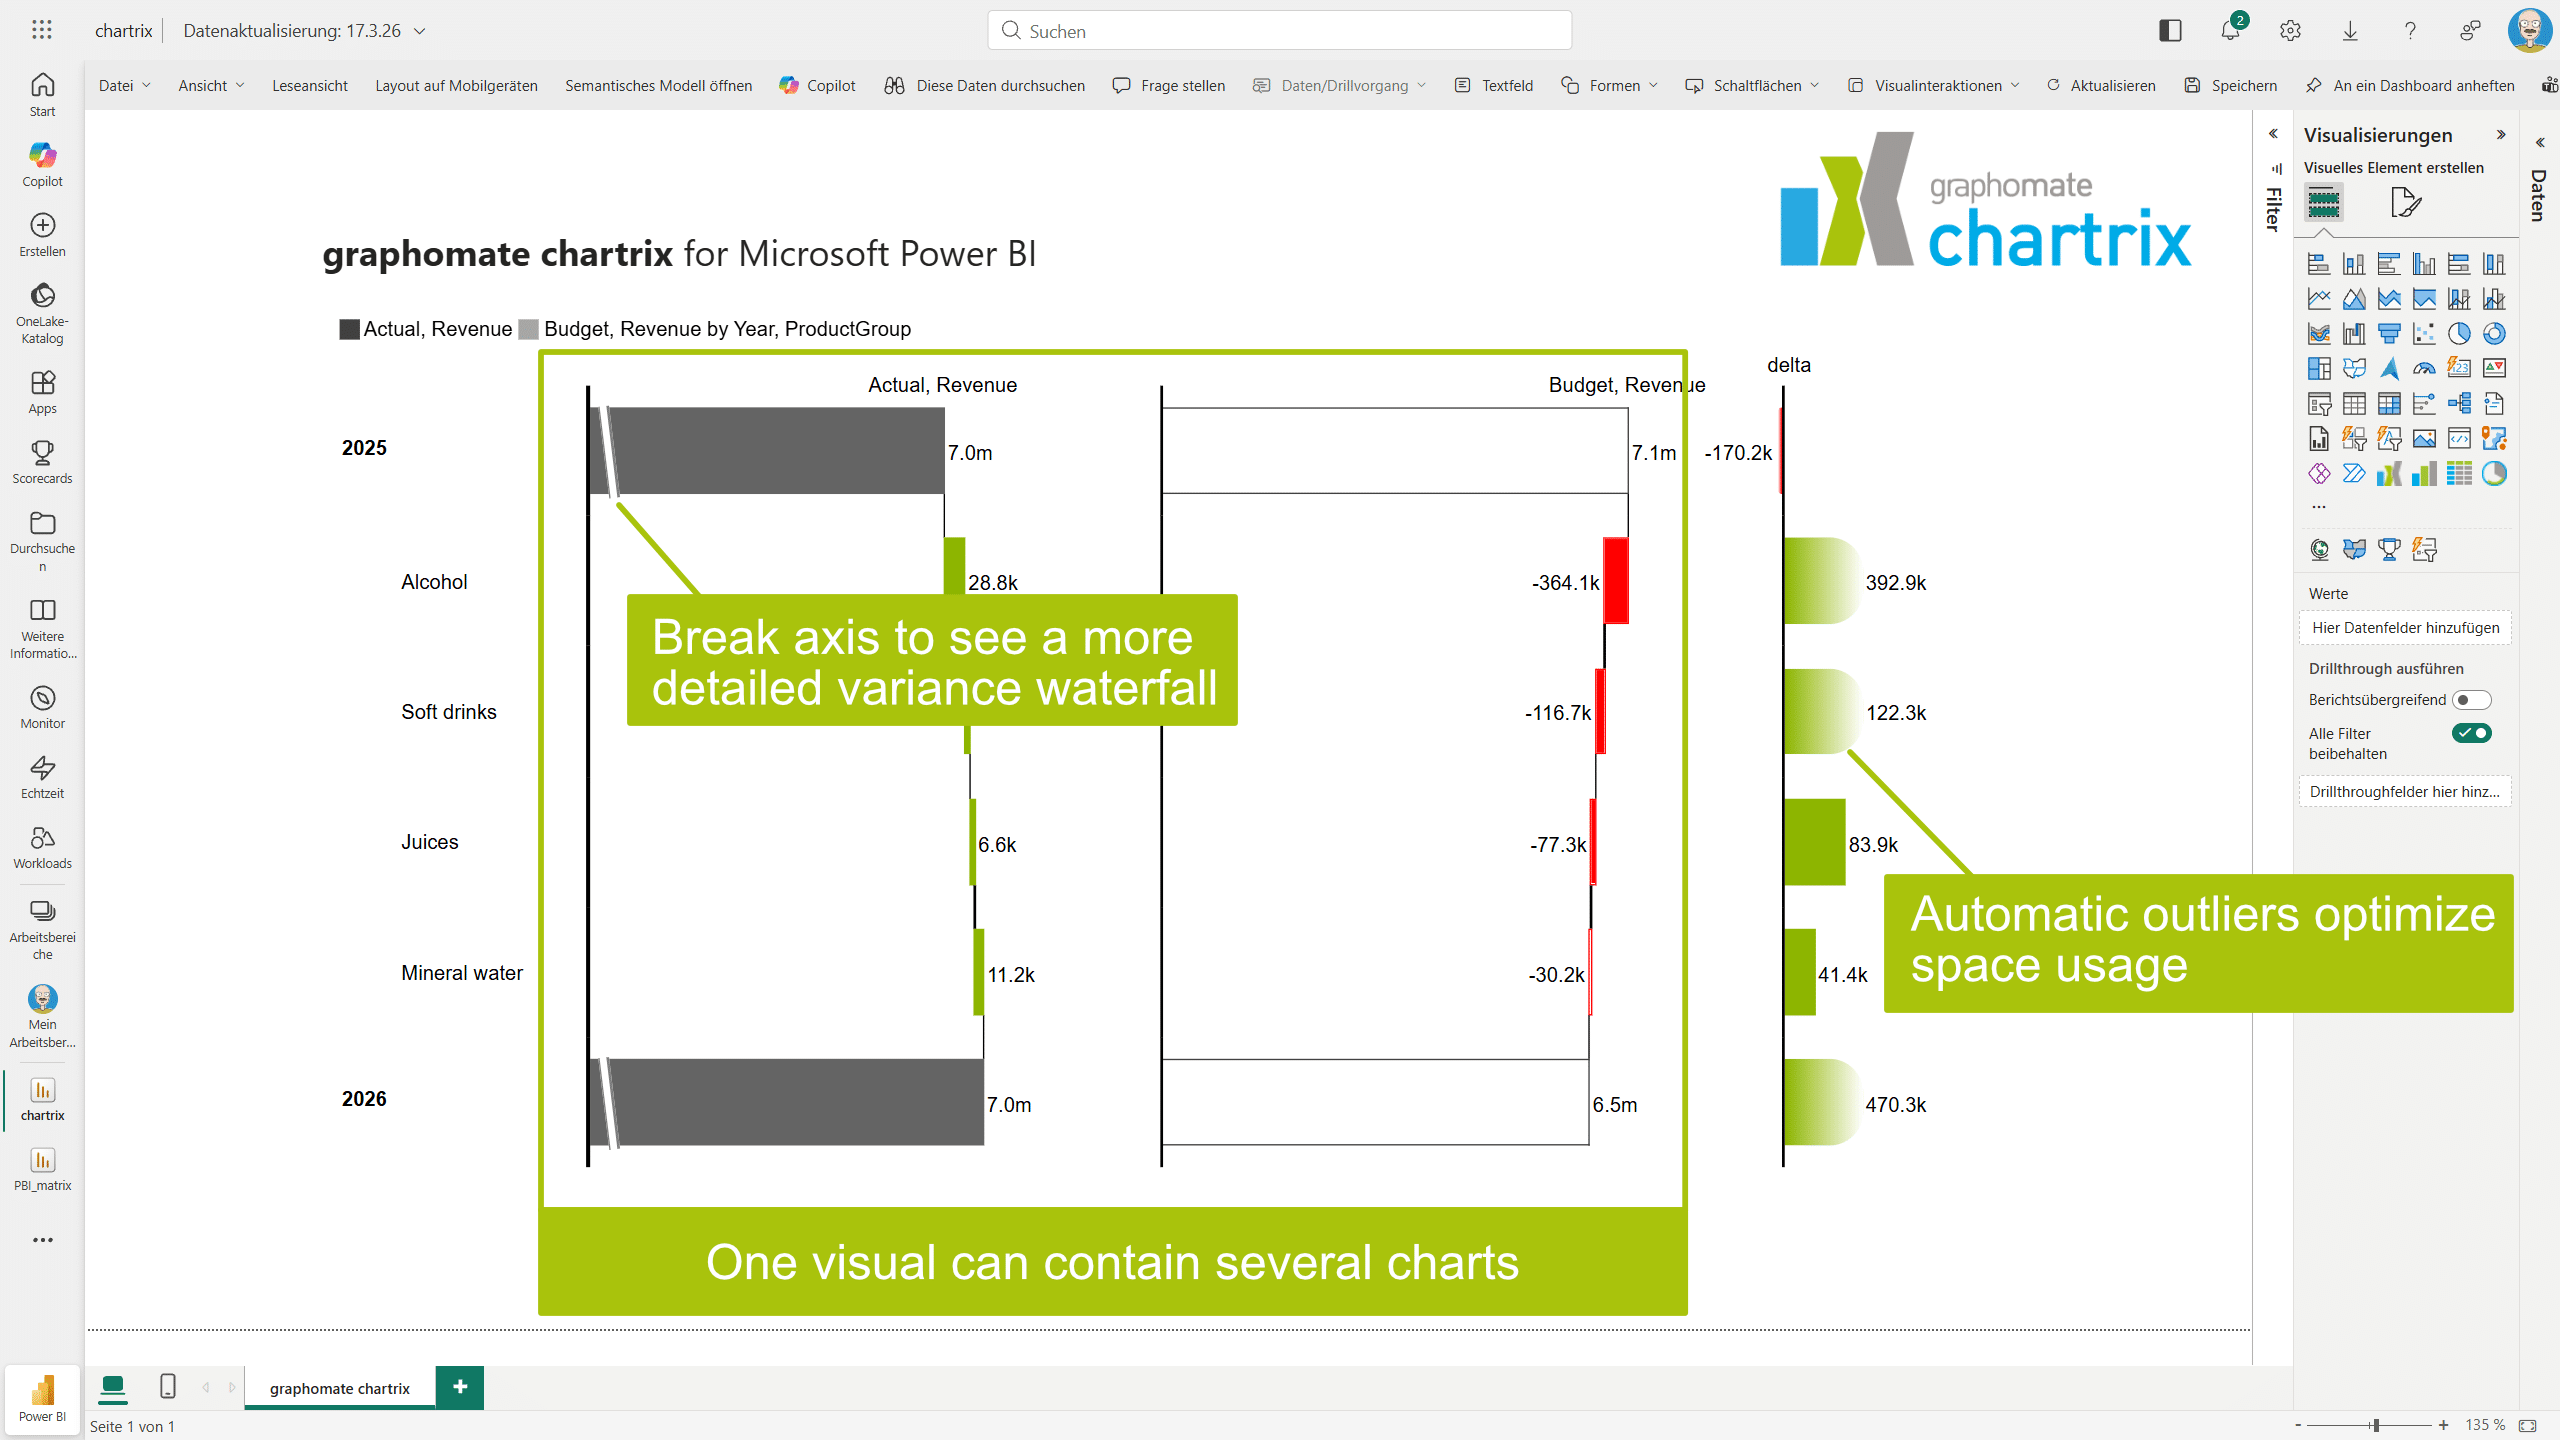
The graphomate chartrix is our latest charting visual, and it offers various improvements over graphomate charts. First and probably most obvious is the new interactive user interface which enables users to define most elements of the chart layout directly on the visual. To keep this interface effective and uncluttered we focus on the most important parameters of your chart.
Users can now create combination charts which were simply not possible before. We also provide new chart types like the variance waterfall, which automatically renders from one measure and two dimensions. Of course, the graphomate chartrix is IBCS® certified. With the latest release we also introduced our XFL editor, which helps you write scripts to format the chartrix far beyond the possibilities of the regular option set. XFL scripts also provide a way to conditionally format the visualization, dynamically changing properties in relation to the actual data.
We provide this new visual free of charge to existing customers of our graphomate charts. All our development efforts will be focused on making the graphomate chartrix the best IBCS® charting visual there is.
Watch our video to learn more about our graphomate chartrix:
Have a nice day,
Alex

This file is licenced under the Creative Com