Comeback of the graphomate extensions for Microsoft 365

The day has finally arrived: Our graphomate charts and matrix are available for Microsoft 365. Rely on our dream team in Excel and PowerPoint to visualize your data and benefit from the functionalities of these tools.
For many years our customers have been using graphomate charts for Excel for their reporting and ad-hoc analyses. With the technological change in the background of the well-known MS Office products, the possibility has opened up for us to provide the graphomate suite and consequently to replace the “old” graphomate charts for Excel 1.8.3.
In this post, we spotlight the benefits of using graphomate charts and matrix in conjunction with your Microsoft 365 subscription:
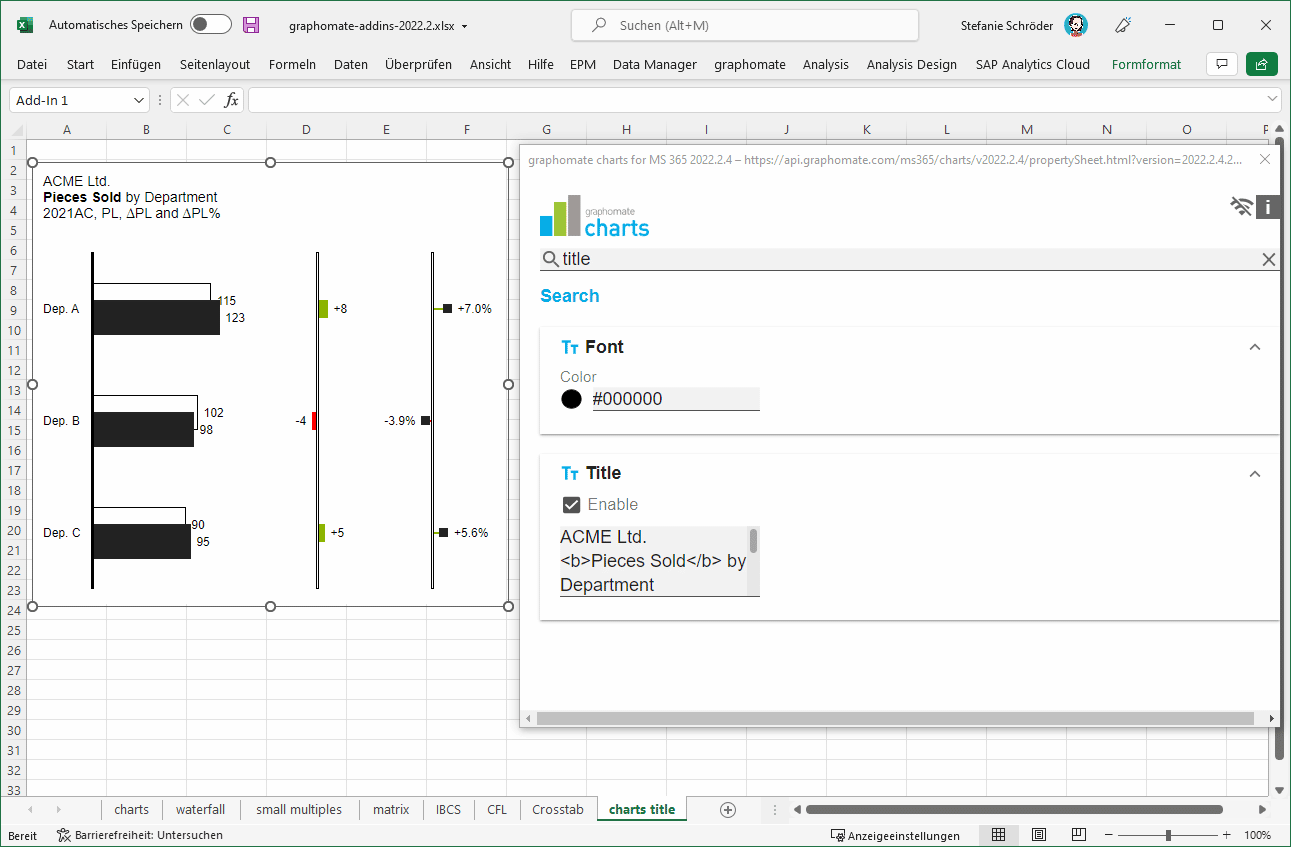
graphomate charts in Excel – the professional tool for IBCS charts
With the completely redesigned graphomate property sheet, the formatting of the add-ins can be done with just a few clicks. The title section in the graphic is also new. This can now be inserted directly in the graphomate chart and formatted with HTML tags. Likewise, the display of values can be formatted down to the smallest detail.
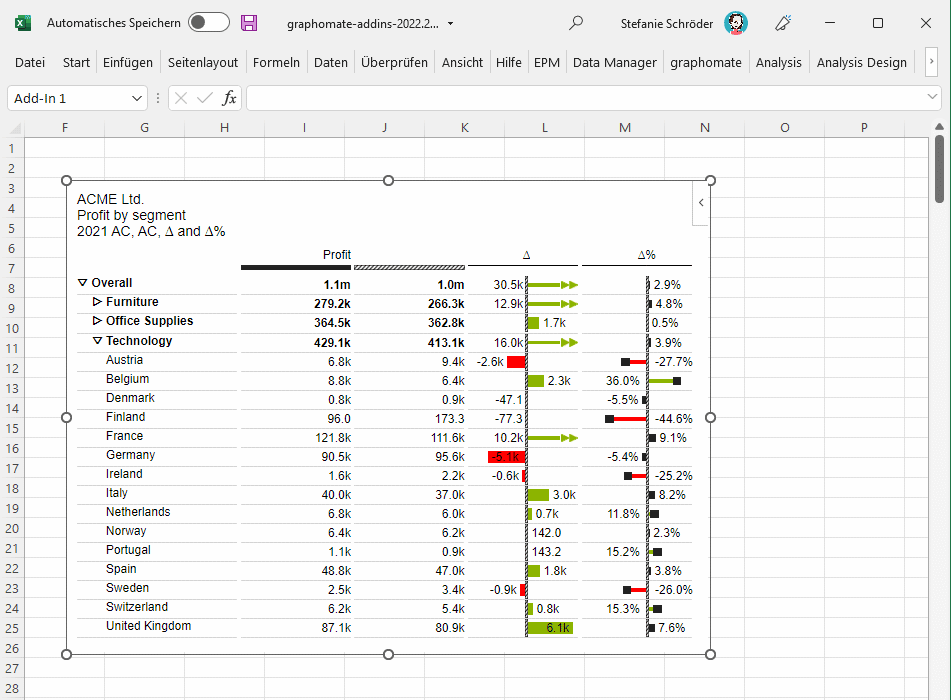
The graphomate charts and matrix are IBCS certified. In the standardized presentation of measures, defined specifications are used for scenarios; thus, black filled bars symbolize actual measures and outlined bars symbolize plan measures. With just a few clicks you can visualize your data and adapt it according to your company notation.
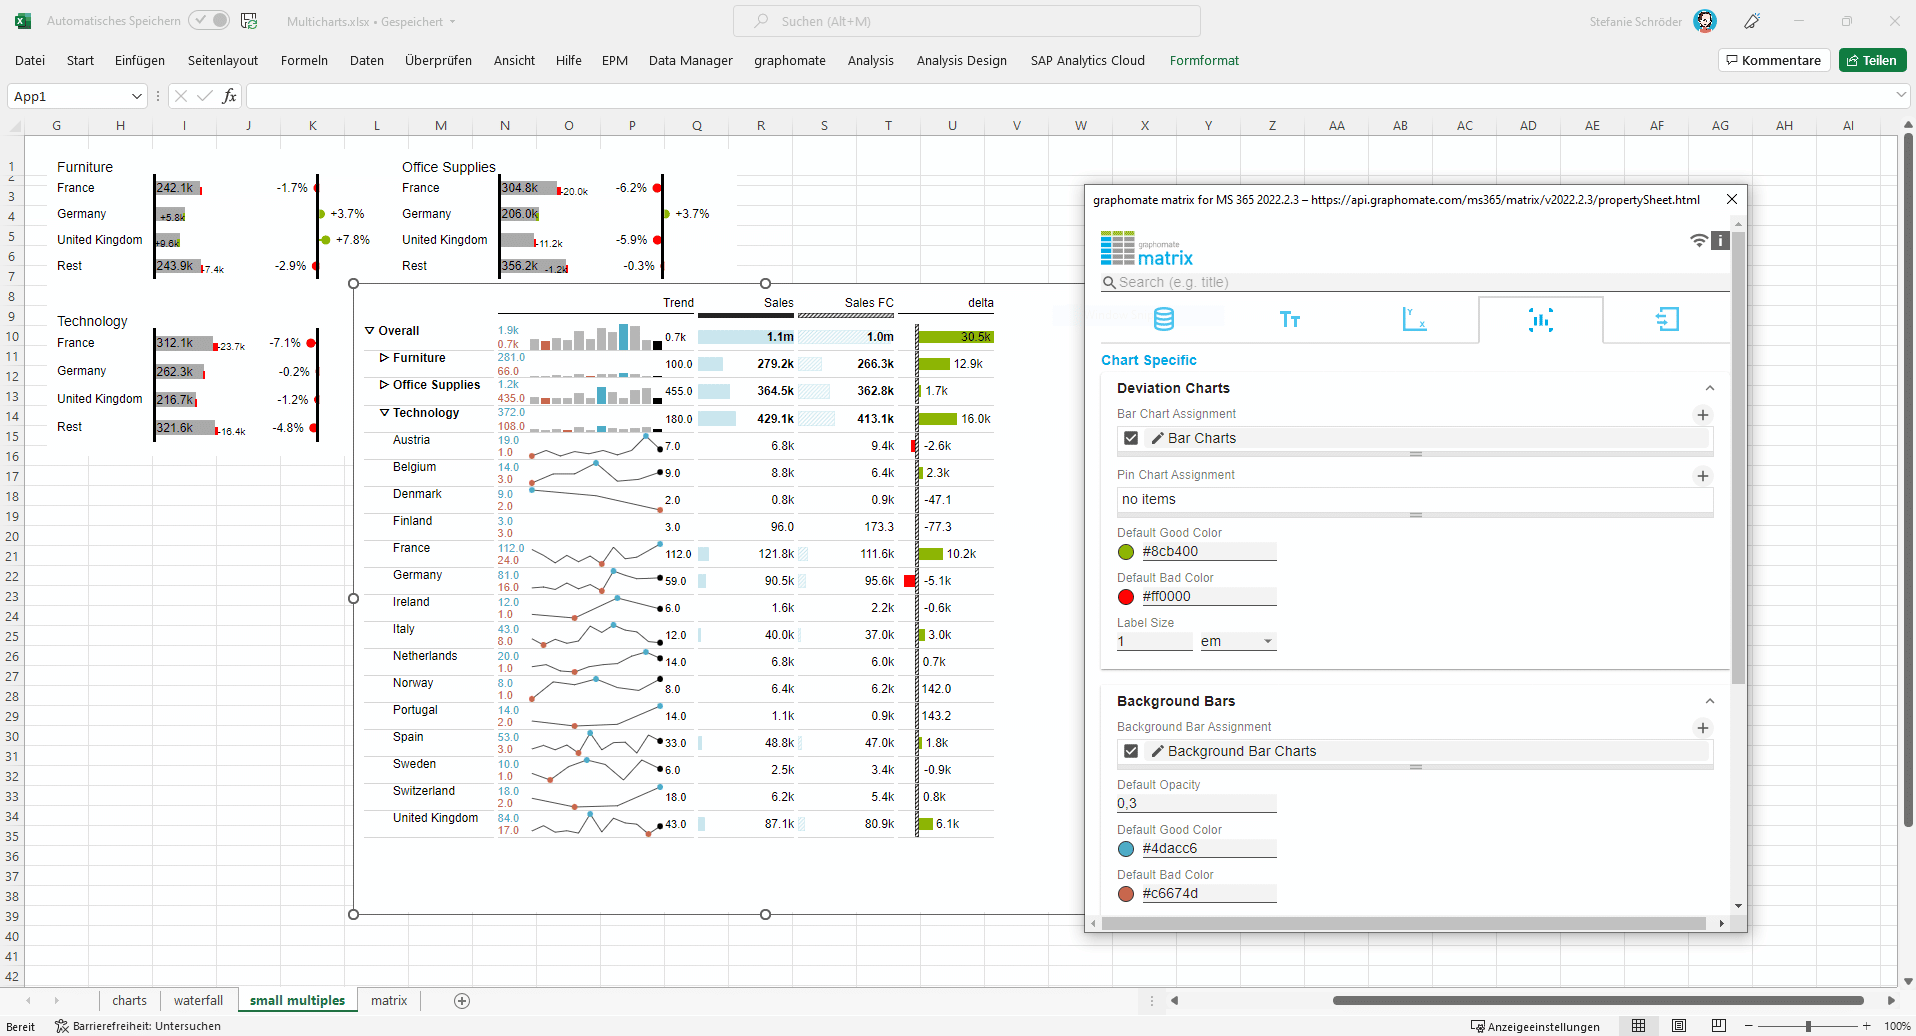
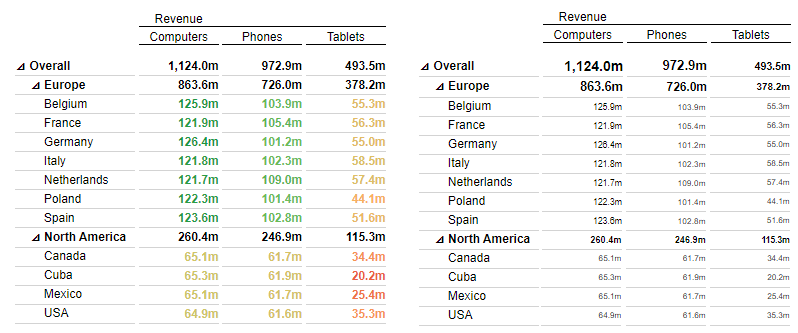
graphomate matrix – implement the IBCS table layout with a few clicks
Quite often we received the question, how to realize the IBCS standard tables in an easy way? Finally we have the answer: With the graphomate matrix!
Skip the manual adjustment of individual cells in tedious time-consuming work. With the matrix, styling according to IBCS will be a breeze.
In addition, our table component offers numerous other options for visually representing your data. For example, use the sparkbars to track the development of a measure over time and discover trends.
In addition to the classic IBCS layout, the graphomate matrix provides the possibility to display the data in a crosstab view. If desired, alternating line colors can be activated for better readability.
Implement your requirements for conditional formatting in the component itself with the in-house developed Cell-Formatting-Language (CFL).
An example: indicate defined value ranges in your data by means of self-defined color values (a.k.a. heatmaps). You are free to specify whether you want to colorize the font or the area of the cells. More examples for the use of CFL rules can be found here. As you can see, graphomate matrix offers you a lot of potential for visualizing your data according to your needs.
Good to know – useful features in the MS365 environment
Your benefit: Many of the MS365 functionalities can be used effectively in conjunction with graphomate charts and matrix.
Cell-related setting of properties – The property binding
Working with formulas and cell references is indispensable in Excel. With the so-called property binding, many properties of the charts and matrix can be controlled. Define a cell reference, store corresponding values such as texts or numbers and make use of the automatic adjustment of your graphics. We would like to give you an example as inspiration:
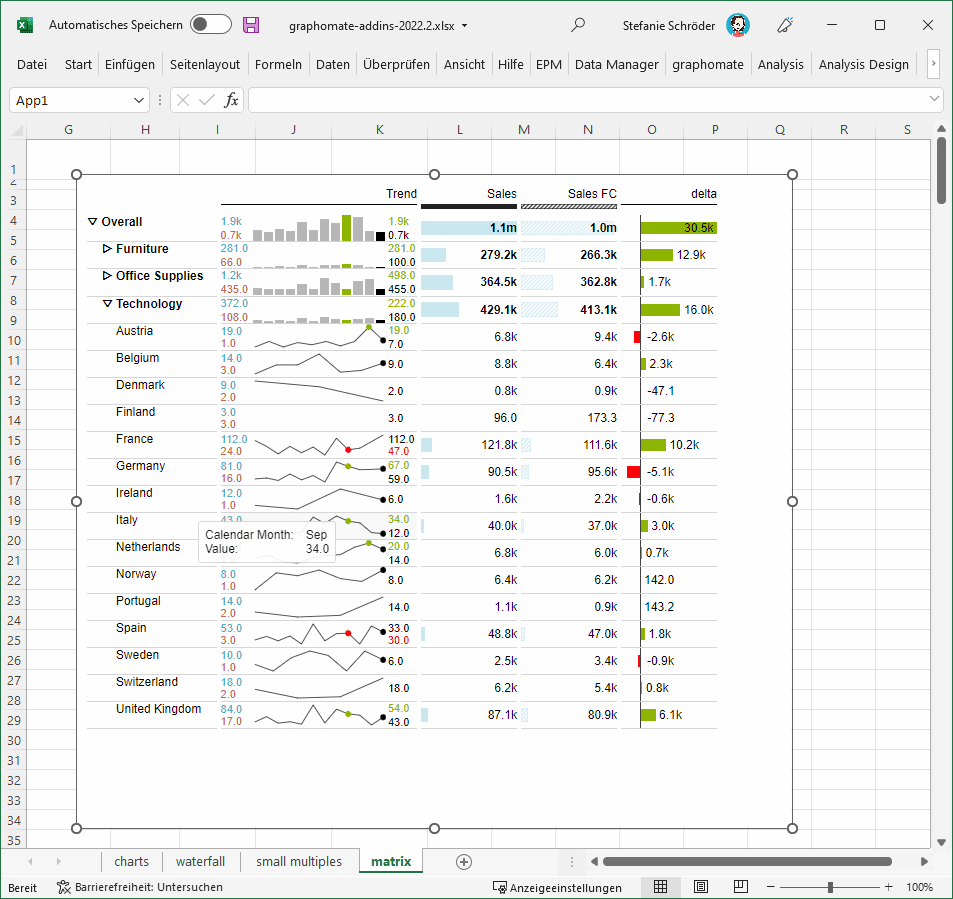
Dynamic setting of thresholds
For example, you have created a graphomate chart and want to dynamically adjust the value for the orientation line (called Scaling Helper). Use the dialog to link the desired property to a cell. Once the link is established, the graphomate add-in will react to changes in the referenced cell.
This function of our add ins is able to receive results of formulas in a cell. This opens up possibilities for automating the creation of reports and charts. For example, the current month could be determined by a formula and the display of scenarios in a chart representing 12 months could be adjusted accordingly by our add-in.
The integrated linking of graphomate graphics from Excel to PowerPoint
Your managers and/or decision makers receive management reports in the form of PowerPoint presentations? Thanks to the linking function (also known as embedded linking) between Excel and PowerPoint, graphomate charts or graphomate matrix visuals can be seamlessly integrated into the desired presentations. If the data from the source systems change, you can decide by yourself whether the graphics should be updated accordingly.
Another highlight in the graphomate matrix: The table component can still be used interactively in PowerPoint (in the presentation mode). Expand and collapse the hierarchy levels of the table at any time to adjust the level of detail as needed.
Now it’s your turn: test the add-ins by yourself and explore the potential of graphomate charts and matrix.
Please note that we will not continue to develop the existing “old” graphomate charts for Excel and that support will expire at the end of 2023. Of course, you can continue to use this product anyway.
Our graphomate suite for Microsoft 365 is based on a completely new technology stack compared to the existing graphomate charts for Excel (1.8.3 and earlier versions). For this reason, we cannot offer you a complete migration path. Please feel free to contact us in case of doubt.
Stefanie

This file is licenced under the Creative Commons-Licence.