Audi AG: Successful Proof-of-Concept with graphomate charts
Our partner ABRACON has sucessfully conducted a proof-of-concept with SAP BusinessObjects Design Studio and graphomate charts based on SAP HANA at Audi AG. AUDI AG relies on products from SAP BusinessObjects for a long time. For the creation of dashboards suitable for management staff they have used SAP BusinessObjects Dashboards (Xcelsius) yet. With version 1.2 it was now time to take a closer look at SAP BusinessObjects Design Studio.
These were the essential new requirements:
- mobile usage of dashboards,
- SAP HANA as data base,
- visualization with “Hichert” charts.
The first two points were covered by Design Studio by default:
The developed dashboard could be used mobile directly and the access to the data via SAP HANA and SAP BW worked quickly and well. Still missing functionalities of Design Studio 1.2 as commentaries, export functions or the report-report interface were easily added.
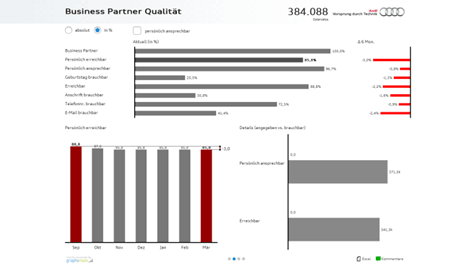
The demand for “Hichert” charts led to our graphomate charts add-on für Design Studio, which allows quick and easy to implement the required visual language of the department. Below you can see a sample page of the Audi dashboards:

The conclusion of the Proof-of-Concept: Design Studio 1.2 can be used productively and convinced the departments also visually with the graphomate charts add-on.
I would like to thank all involved of Audi and Abracon for the great solution and the opportunity to present this.
I would like to take the opportunity and point to the 6th ABRACON BI Strategy Days 2014, which take place in Neuss on 22 and 23 May 2014 (Hotel Fire & Ice). There I will give a talk entitled “An opportunity for the eye: From trash- to dashboard – Meaningful visualizations by HICHERT©SUCCESS with SAP BusinessObjects”.
You can find all details of the 6.ABRACON BI Strategy Days here. I’m looking forward to meet you!
Have a nice weekend,
![]()
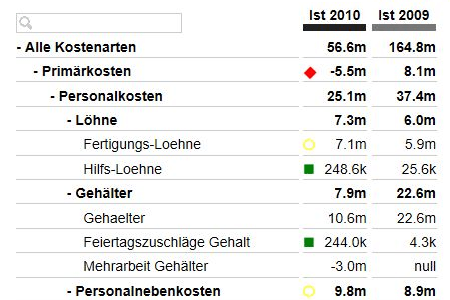
PS: Psst … here is a first BETA of our tables add-on for Design Studio with exceptions and filter box:
Currently we work on in-cell charts for deviations in this table and also bullet graphs and a modular tile add-on will be published mid-year.
_
![]()
This file is licenced under the Creative Commons-Licence.

