Vizualisation: the bikini chart
It is hot, real hot, so the bikini once more enjoys great popularity. A good time to take a closer look at the Bikini Chart.
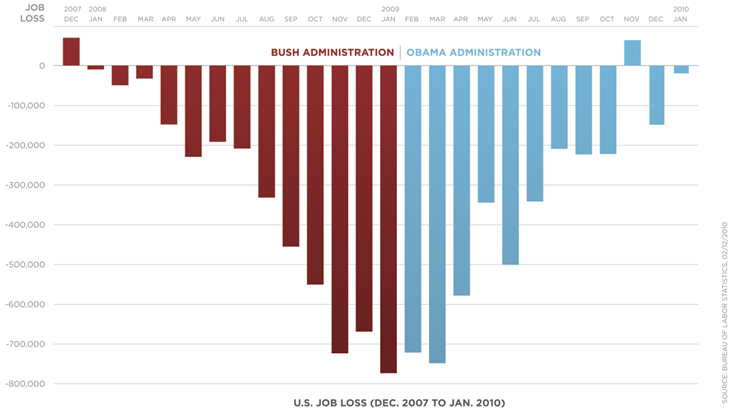
A blog post on the eagereyes website from last year, called “The Bikini Chart”, still sticks in my mid. In this Post, Robert Kosara discusses a visualization based on the development of the job market in the United States over a period of two years:
Source: http://eagereyes.org/blog/2012/bikini-chart
The chart shows the monthly job losses in the last year of the Bush administration and in the first year of Obama’s term – from December 2007 till January 2010. A rather effective chart – even good for political use – with only few decorative elements: there is only one color distinction in the columns between Bush (red) and Obama (blue) – as well as a scale. The color distinction is skillfully used: Taking a closer look at the Red color one can see a gradient to a deep dark red. In comparison, the bright blue used for the Obama administration gives a cheerful impression. The appearance of the well-received chart – Stalactite-like columns – gave rise to nickname “Bikini Chart”.
The message is clear: During the Obama administration, the number of job losses regressed. But nevertheless, the number of jobs during this period is still decreasing. A fact which is not immediately evident, as the chart represents the absolute change of one month in comparison to its preceding month. The fact that still more people are losing their jobs than people are being recruited is skillfully concealed.
I am a big fan of visualizing changes – in absolute numbers as well as in percentage. The presentation of planned/actual deviations creates context which enables an easier understanding and interpretation of the basic data.
Our addon for Design Studio and Dashboards allows you to represent deviations at the touch of a button. Changes which are regarded to be positive are shown in green, whereas changes regarded as negative are shown in red. But I do think that it is important to show deviations in their context. Only in conjunction with the underlying basic data it is possible to provide comprehensive information for the viewer. Take a look at the redesign of the bikini chart, made with SAP BusinessObjects Dashboards and our graphomate charts addon.
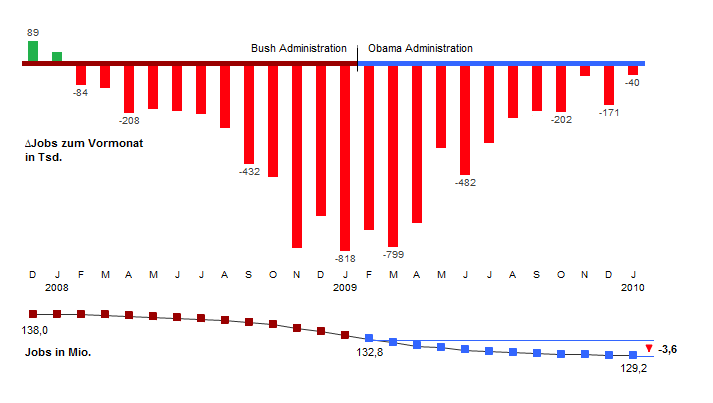
I have deliberately refrained from a correct scaling of the line. I wanted to show a trend, not a comparison with the bikini chart above. Something that you don’t do according to the “true teaching”.
Fortunately, the positive trend in the American job market has continued. As a result, the bikini chart seized to exist – too bad.
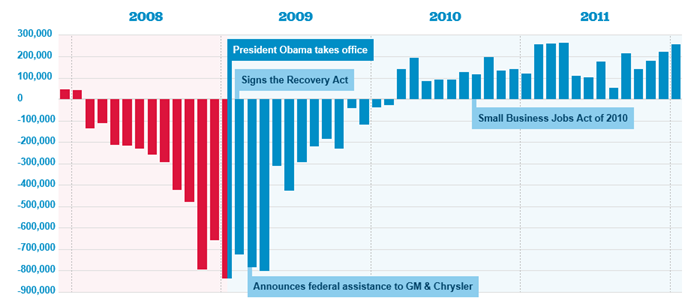
Source: http://mashedpotatobulletin.com/2012/02/07/the-daily-scoop-obama-job-creation/
Looking at the negative columns I had to think about a memonic device, which helps to remember the difference between stalagmites and stalactites: The rent mite rise and the tites … let’s not talk about it! I never forgot that 😉
Enjoy some sunny days,
![]()
_
![]()
This file is licenced under the Creative Commons-Licence.