The Imperfect World

In an ideal world, where data could be visualised in simplified and structured way, the Business Intelligence users would be happy people. Unfortunately, this is not always the case in SAP BusinessObjects Web Intelligence (WebI). Now we are at the point, where the graphomate extensions for WebI come into the game.
The International Business Communication Standards developed by Rolf Hichert consist of rules of how reports, dashboard and presentations should be designed. Futhermore they deal with the concept of charts and tables, which are used in them. The SUCCESS-Rules, which are part of the IBCS, contain more than 100 rules about business communication.
In conclusion the IBCS state that diagramms should be free of unnecessary visual elements and gimmicks. You should always bare in mind “less is more”. Another recommandation is that elements like shapes, symbols and colors should be used in a consistent way all over the report. Furthermore visual presentations should be honest, which means that information should not be hidden to misinform the recipient. If you like to gather more information about IBCS and SUCCESS rules please visit www.ibcs.com.
That said: One of our customer had to use 27 layered standard charts to implement a dashboard following the IBCS. With the help of our extensions, the time and effort for creating reports has been significantly decreased.
Visualizing business data without following IBCS could lead to the fact, that information that is visualized could be misinterpreted and thus decisions of the recipient could be based on wrong assumptions.
Please consider that decision makers never think in absolute values. Values are always compared to each other. So deviation charts are a fine way to display information regarding business processes. Facing this fact, our extensions support deviations. Both extensions are highly configurable and customizable.
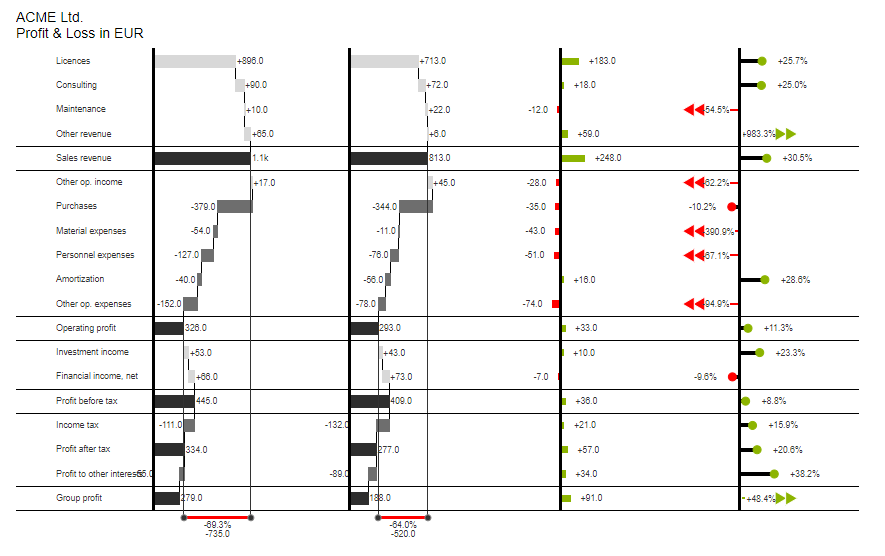
graphomate charts for WebI
The graphomate charts offer six chart types which can be aligned vertically or horizontal. They can be adjusted to follow all the same notation concept. Furthermore deviation charts can be added. To make the visualizations comparable, all charts can use the same scaling.
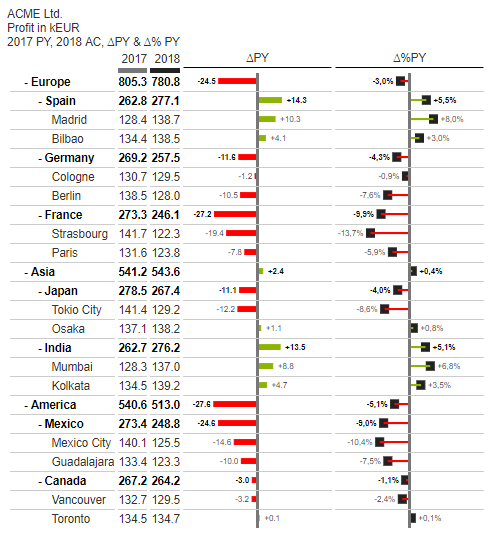
graphomate tables for WebI
The graphomate tables are mixing the hicharchical table layout with deviation charts as columns and “in-cell” charts. Just like in the graphomate charts everything can be scaled equally.
In this video I will demonstrate in 2 minutes how to handle the main functionallity of the graphomate extensions in WebI.
If you like to get more information about the possibilities of our WebI extensions please visit www.graphomate.com and do not hesitate to inquiry your personal trial version.
With best regards
Daniel
![]()
This file is licenced under the Creative Commons-Licence.