graphomate Christmas treemaps for free

Christmas is coming and we do look forward to a peaceful time, family and the Christmas tree. Gifts play a certain role and we do not want to come second: during Christmas season, our graphomate treemaps for SAP Business Objects Design Studio are available for free – “Christmas-treemaps” literally 🙂
About treemaps
What is a treemap and what can it be used for?
Treemaps represent large amounts of hierarchically organized data in a very small space. Two key figures are represented by a rectangle: The size of the rectangles constitutes the first measure, while the color of the rectangle represents the second indicator value.
Have a look at this example:
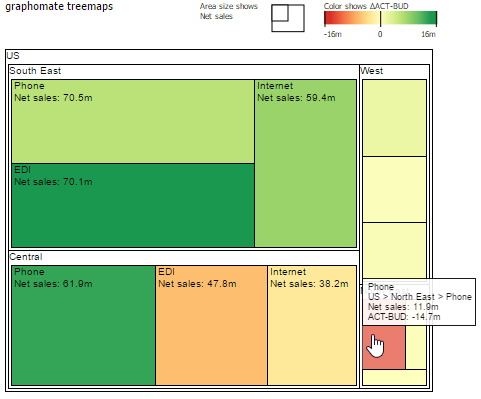
Thus, treemaps are suitable to display lots of data points in a way that is easily perceivable by humans – at least regarding the most important elements that can be interpreted as proportions and color gradations of “tiles” quickly. For this reason treemaps work very well as entry to interactive dashboards. On the other hand treemaps reach their limits when it comes to precision and accurate comparison between values. Therefore we offer further components such as our graphomate charts or graphomate tables which can be used as drill down targets from the treemap by a mouse click.
graphomate treemaps for Design Studio
What has caused us to build a treemaps add-on when there is already a standard treemaps component in Design Studio?
Well, quite simply: the standard treemaps are not flexible enough and did not meet our requirements.
Here is a list of the highlights of our graphomate treemaps:
Advanced Propertysheet
Like the graphomate charts and tables, the treemaps come with an easy-to-use user interface that allows quick and concise adaptation of the component.
Color scheme
The graphomate treemaps support color schemes of colorbrewer. As a result, various schemes can be integrated with the treemaps component, depending on the application scenario; also color scales for color blind people are offered.
Informative Legend
The legend should show at a glance which measures are represented by area and by color; it also eases orientation and interpretation of the treemap.
Automatic calculation of deviations
Absolute and percentage deviations between Area Series and Color Series can be calculated automatically by our component.
Configurable caption and tooltips
What information should be visible? During runtime, what is shown with a hover over a tile in the tooltip? This information can be easily adjusted via the Property Sheet. Additionally, you can control whether labels are always displayed or only as long as there is enough space for them in a tile. This minimizes visual noise (cut-off labels without informational use).
Hierarchy Resolution
graphomate treemaps are based on our proven logic for resolving implicit – derived dimensions – and explicit BW hierarchies that is already used in our graphomate tables.
Embedded mode
If the hierarchy levels are not easy to grasp at first glance, the graphomate treemap provides a so called embedded mode. This explicitly shows the hierarchy levels again – without demanding much space.
Scripting Language Integration
As mentioned above, treemaps provide an easy access point into an interactive dashboard. In order to enable communication with the underlying data source, and other components, a good integration with the script language needed. This is directly supported by the graphomate treemaps add-on.
The following video gives you an impression of the functionalities of graphomate treemaps:
Concluding with the Best
For those who have persevered this far, we have a small reward on offer: During the period from 10/12/2014 and 15/01/2015 the graphomate treempas could be downloaded as a Christmas gift for free.
Merry Christmas,
![]()
_
![]()
This file is licenced under the Creative Commons-Licence.